Why Bitcoin's Hedge Narrative Hasn't Played Out? Five Macro Indicators Reveal the Truth

The system is entering a phase that is more fragile and less forgiving of errors. 2026 could be a crucial turning point for Bitcoin.
Original Article Title: Why the endgame looks uglier than markets are pricing
Original Article Author: arndxt
Original Article Translation: DingDang, Odaily Planet Daily
Over the past few months, my stance has undergone a significant shift: from "bearish to bullish" (a prevailing bearish sentiment, usually laying the groundwork for a squeeze); to "I am very bearish, I am really worried that the entire system is entering a more fragile stage."
This is not due to a single event, but is based on the following five mutually reinforcing dynamic factors:
• Rising Policy Mistake Risk. The Federal Reserve is tightening the financial environment amid data uncertainty and clear signs of a slowdown.
• AI/Tech Giants' paradigm shift from "cash-rich" to "leverage-driven growth." This shifts the risk from mere stock market volatility to more traditional credit cycle issues.
• Cracks in Private Credit and Loan Pricing are beginning to emerge. Although still early, signs of model pricing pressure are visible.
• The K-shaped economy is gradually evolving into a political issue. For an increasing number of people, the social contract is no longer trustworthy, which will ultimately be reflected at the policy level.
• Market concentration itself has become a systemic and political vulnerability. When around 40% of the index weight is dominated by a few tech giants, and they have geopolitical and leverage sensitivity, they are no longer just growth engines but have become targets of national security and policy targeting.
The base case may still be: policymakers will eventually "as usual" inject liquidity, support asset prices to enter the next political cycle. However, the path to that outcome looks more turbulent, more credit-dependent, more politically unstable, far more complex than the traditional "buy on dips" framework assumes.
1. Macro Positioning Shift
For most of this cycle, a "bearish but constructive" stance was reasonable:
• Despite persistent inflation, the rate of increase is slowing.
• Overall, policies continue to be supportive.
• Risk assets have been pushed higher, and every correction has been accompanied by liquidity injections.
However, some factors have changed:
• Government Shutdown: We have experienced a prolonged government shutdown, disrupting the release of key macro data and damaging data quality.
• Rising Uncertainty in the Statistical System: Senior officials have also acknowledged that the federal statistical system has been compromised, reducing the credibility of core data that underpins the pricing of trillions of dollars in assets.
• In this context, the Fed has chosen a more hawkish stance on rate expectations and the balance sheet, tightening financial conditions despite deteriorating forward indicators.
In other words, the system is exacerbating uncertainty and pressure rather than alleviating them. This represents a completely different risk structure.
2. Policy Tightening Implemented in the "Fog"
The core issue is not just whether policy is tightening, but where and how policy is tightening:
• Data "Fog": Post-shutdown, key data (inflation, employment) have been delayed, distorted, or called into question; the Fed's own monitoring tools have become unreliable at the most crucial times.
• Rate Expectations: While forward-looking indicators largely point to continued inflation easing early next year, Fed officials' remarks have been hawkish, significantly reducing market expectations for near-term rate cuts.
• Balance Sheet: In the process of quantitative tightening, the Fed is maintaining its balance sheet stance and is inclined to push more duration onto the private sector, leading to a substantial tightening of financial conditions even if nominal rates remain unchanged.
Historically, Fed mistakes have often been about "timing": raising rates too late, cutting too late. The current risk lies in potentially repeating this pattern—tightening when growth is slowing and data are murky, rather than easing ahead of pressure buildup.
3. Tech Giants and AI Shifting from "Cash Cow" to "Leveraged Growth"
The second structural shift is reflected in the nature of large tech companies and AI leaders:
• Over the past decade, the "Big Seven" have essentially been like bonds: high market share, massive free cash flow, significant buyback programs, and extremely low net leverage.
• In the past two to three years, an increasing amount of this cash flow has been directed towards AI capital expenditures: data centers, chips, infrastructure.
• We are now entering a stage where AI spending is increasingly debt-financed rather than funded by operational cash flow.
This brings several implications:
• Credit spreads and credit default swaps are starting to widen, for example, Oracle, as these companies leverage up to build AI infrastructure.
• Stock price volatility is no longer the sole risk. We are now seeing early signs of a typical credit cycle in what was previously considered the "invincible" tech sector.
• Market structure has exacerbated this situation. These companies' stocks carry significant weight in major indices, and their shift from being cash cows to leveraged growth has altered the risk profile of the entire market.
This does not mean the AI bubble is ending. If capital expenditures have enduring returns, then debt-financed capital outlay is rational.
But it does mean that margins of error are shrinking, especially in a high-interest rate and policy-tightening environment.
4. Credit and Early Cracks in the Private Market
Beneath the surface calm of the public markets, early pressures are appearing in private credit: significant discrepancies in quotes for the same loan across institutions (one party quoting at 70 cents on the dollar while another at 90 cents). This is a classic sign of the "Model Price vs. Market Price" conflict.
This mirrors patterns from 2007–2008:
• 2007: Rise in bad assets, widening spreads, while stock indices remain relatively calm.
• 2008: Previously seen as "cash-like" markets (e.g., auction rate securities) suddenly freeze.
Meanwhile: Reserves in the Federal Reserve system have started to decline; internally, the Fed is also increasingly aware that without balance sheet expansion, the financial market's "plumbing" may experience functional issues.
This does not mean that a crisis is inevitable, but it fits into a situation where: credit is quietly tightening, yet policy language remains stuck in a "data-dependent" mode rather than proactively addressing the situation.
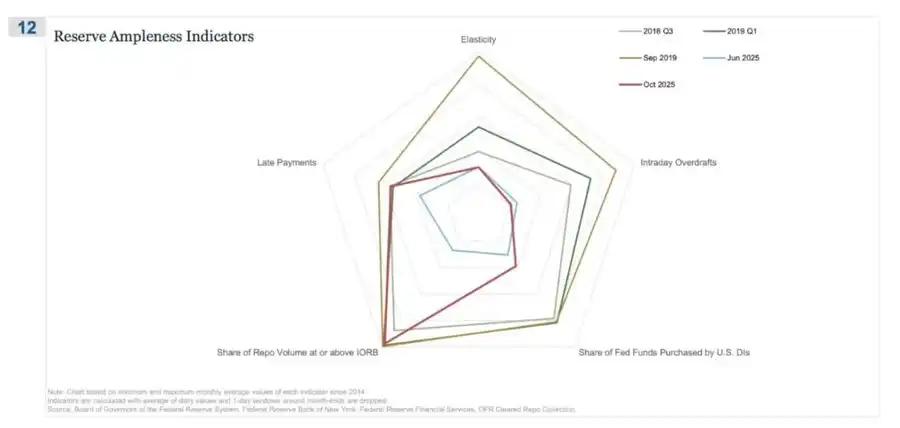
REPO (Repurchase Agreement) was the first place where the signs of "reserves are no longer abundant" appeared
In this spider chart, the "Repo Transaction Share hitting or exceeding IORB" is the most straightforward signal, showing that we are quietly moving away from a genuinely ample reserve state.
During Q3 2018–2019, the volatility was still relatively manageable: reserves were plentiful, and most secured funding rates were below the Interest on Reserves (IORB) floor.
By September 2019 (eve of the repo market turmoil): this line expanded sharply as more and more repo rates touched or exceeded IORB, a typical signal of collateral and reserve scarcity.
Now looking at June 2025 vs. October 2025:
• The light blue line (June) is still safe; but the October red line is nearing the 2019 profile, indicating that more and more repo trades are hitting the policy rate floor.
• In other words, traders and banks are bidding up the cost of overnight funding as reserves are no longer "comfortably abundant."
• When combined with the other indicators on the spider chart (intraday overdraft increase, Fed's federal fund purchases increase, and overdue payment increase), a clear message can be derived.
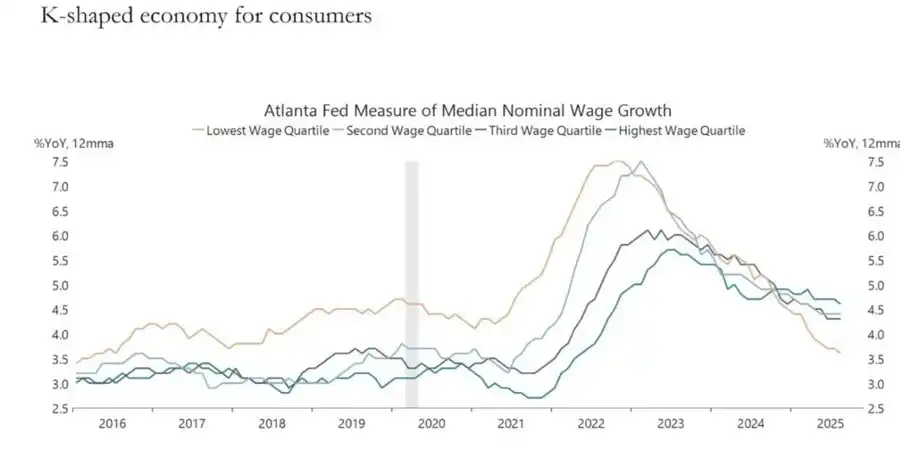
5. The K-shaped Economy is becoming a Political Variable
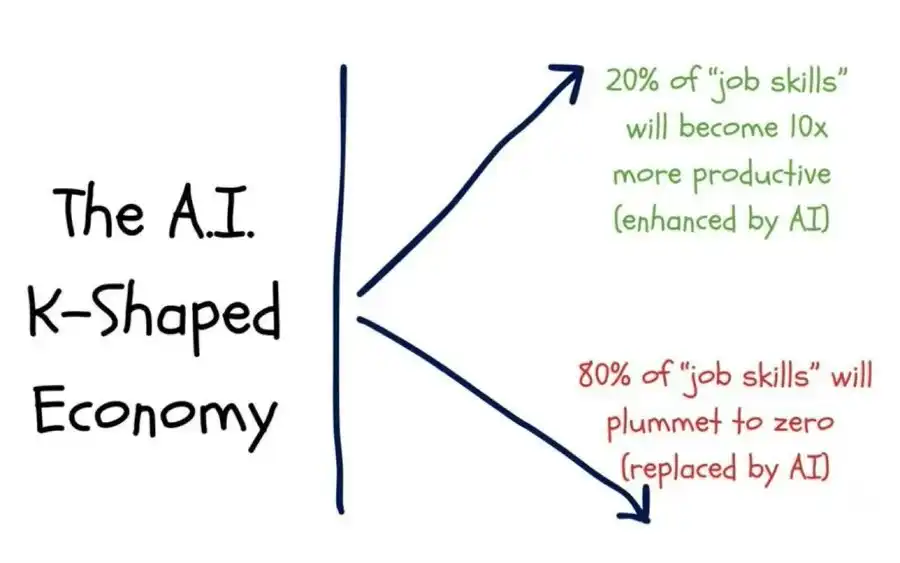
The author of this article previously explained in the "Dual-layer K-shaped Economy" article, defining the K-shaped economy as different parts of the economy moving in completely opposite directions within the same cycle:
• The upper half of the K → Capital markets, asset holders, tech industry, large corporations → Rapidly rising (profits, stock prices, wealth soaring simultaneously).
• K-Shaped Recovery → Wage Earners, Small and Medium-sized Enterprises, Blue-collar Industries → Decline or Stagnation.
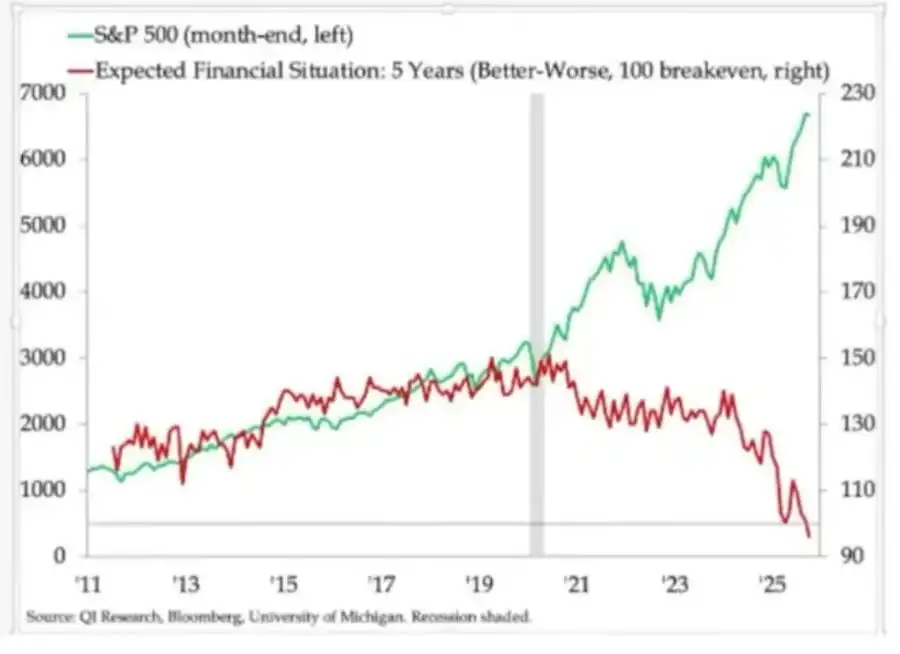
What we used to refer to as the "K-shaped economy" divide, in my opinion, has evolved from being just an economic phenomenon to becoming a political variable:
• Household Expectations are showing clear divergence. Longer-term financial outlooks (e.g., 5-year expectations) vary significantly: some groups expect stability or even improvement, while others anticipate a noticeable deterioration.
• Real-world stress indicators are also flashing warning signs: Subprime auto loan delinquency rates are rising; the age for homebuying continues to shift later, with first-time homebuyers' ages nearing retirement; youth unemployment rates in multiple markets are consistently on the rise.
For the rapidly expanding social stratum, the issue is no longer just "inequality"; the system itself is increasingly dysfunctional for them:
• They have no assets, limited wage growth, and can hardly envision a realistic path to participating in asset inflation.
• People's fundamental understanding of the social contract — "work hard, progress steadily, eventually achieve wealth and security" — is collapsing.
In such an environment, political behavior begins to change:
• Voters are no longer choosing the "best steward of the status quo."
• They are increasingly willing to support radical or disruptive candidates from both the left and right, because in their view, their downside risk is extremely limited: "It can't get any worse anyway."
A series of policies in the future related to taxation, redistribution, regulation, and monetary support will be formulated against this backdrop.
And this is clearly not neutral for the market.
6. Market Concentration as Systemic and Political Risk
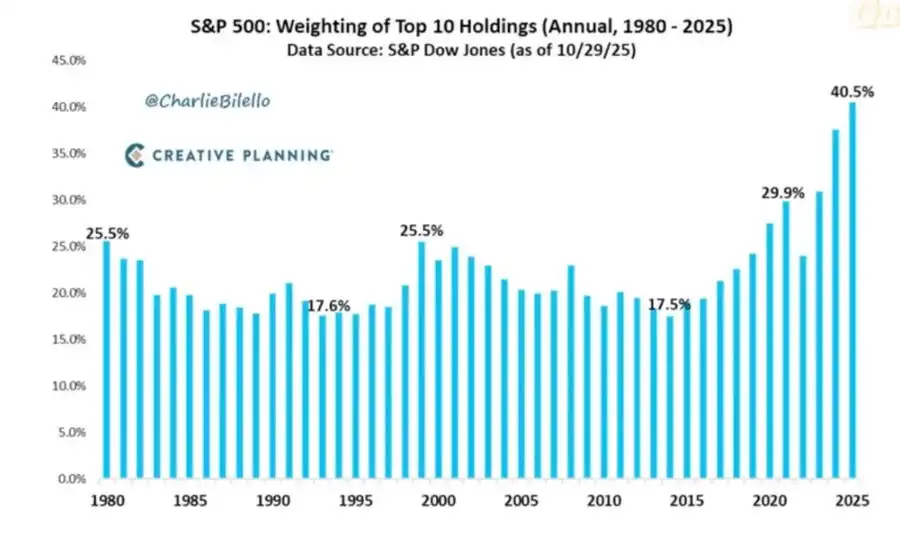
The total market value is highly concentrated in a few companies. However, what is less discussed is the systemic and political implications behind this structure:
Currently, the top 10 companies hold around 40% of the market value of the major U.S. stock indices.
These companies share the following characteristics: they are core holdings of pension funds, 401(k) plans, and retail portfolios; closely tied to AI in their business, heavily exposed to the Chinese market, and highly dependent on interest rate paths; and they practically act as monopolists in multiple digital domains.
This brings about three intertwined risks:
• Systemic Market Risk
Once these companies face profit, regulatory, or geopolitical shocks (such as the Taiwan issue or changing Chinese demand), the impact will quickly transmit throughout the entire household wealth system.
• National Security Risk
When such a large proportion of national wealth and productivity is concentrated in a few externally reliant companies, they themselves become strategic vulnerabilities.
• Political Risk
In an environment where the "K-shaped" recovery coexists with populist sentiments, these companies are most likely to become focal points of dissatisfaction:
• Higher taxes, windfall taxes, buyback restrictions;
• Splitting driven by anti-trust initiatives;
• Stricter AI and data regulations.
In other words, these companies are not only growth engines but are also becoming potential policy targets, and this possibility is on the rise.
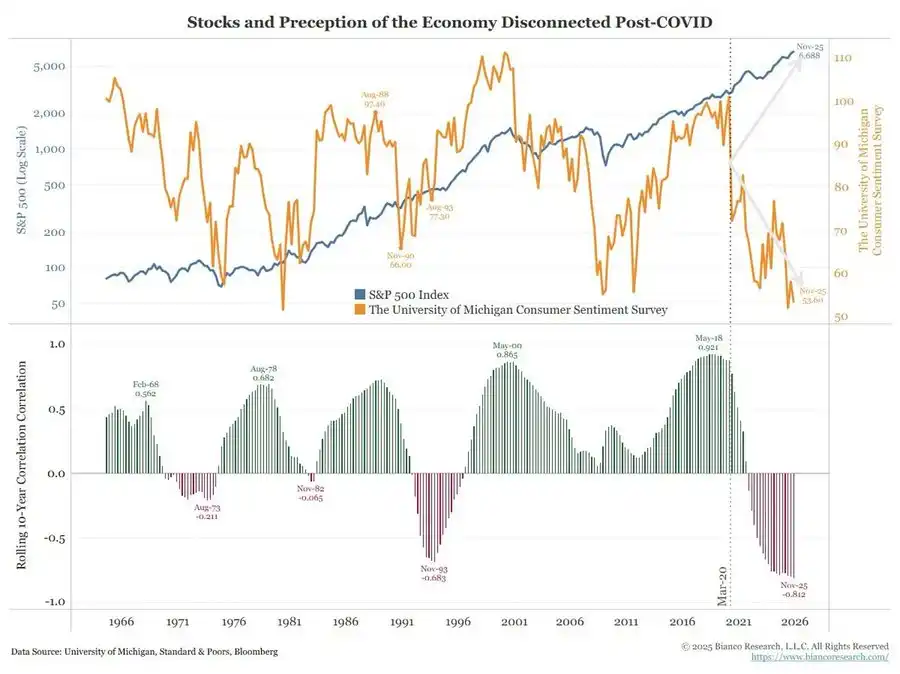
7. Bitcoin, Gold, and the Unrealized "Perfect Hedge" Narrative
In a world of policy error risk, credit pressure, and heightened political instability, one might expect to see Bitcoin shine as a prominent macro hedge tool. However, the reality is:
• Gold is playing the role of a traditional crisis hedge: showing steady performance, low volatility, and increasing importance in asset allocation.
• Bitcoin is more like a high Beta risk asset in trading: closely tied to the liquidity cycle; sensitive to leverage and structured products; OG long-term holders are taking advantage of the current environment to reduce their positions.
The initial narratives of decentralization and the currency revolution are still conceptually appealing, but the reality is:
• The current dominant fund flows mainly come from financialized behavior: yield strategies, derivatives, short vol patterns.
• Bitcoin's true performance is closer to a Technology Beta rather than a neutral, robust macro hedge.
I still believe that 2026 might be a pivotal year for Bitcoin (a new policy cycle, potential stimulus, and further erosion of trust in traditional assets could collectively form this turning point).
However, investors need to recognize: at this stage, Bitcoin has not yet provided the anticipated hedging properties for many; it remains part of the liquidity complex we are concerned about.
8. Scenario Framework Toward 2026
One useful way to understand the current environment is to view it as a "controlled bubble deflation" aimed at making room for the next round of stimulus.
The potential sequence may look like this:
1) Mid-2024 to 2025: Controlled Contraction and Pressure.
• Periodic drags from government shutdowns and political disarray;
• The Fed tilting hawkish in rhetoric and on its balance sheet, tightening the financial environment;
• Credit spreads slightly widening; speculative sectors (AI, long-duration tech, some private credit) leading the absorption of the shocks.
2) Late 2025 to 2026: Entering the liquidity reinjection phase of the political cycle.
• With falling inflation expectations and market corrections, policymakers regain "loose space";
• Rate cuts and fiscal measures start emerging, calibrated around growth and election targets;
• Inflation consequences will manifest post key political milestones due to lagging effects.
3) Post-2026: Systemic repricing.
The scale and form of the next stimulus will determine the future trajectory:
• Either another round of asset inflation with stronger political and regulatory intervention;
• Or a more direct confrontation of structural issues around debt sustainability, concentration, and social contract.
This framework is not definitive but aligns closely with the current high incentives:
• Political figures prioritize re-election rather than long-term balance;
• The most easily used policy tool is still liquidity and transfer payments, rather than structural reform;
• And to use these tools again, they first need to squeeze out the current bubble.
Conclusion
Various signals all point to the same conclusion: the system is entering a more fragile, less forgiving stage of the cycle.
From historical patterns, policymakers will eventually respond with a large amount of liquidity. But before entering the next stage, we must go through a period characterized by the following features:
• Stricter financial conditions,
• Higher credit sensitivity,
• More intense political turmoil,
And increasingly nonlinear policy responses.
Disclaimer: The content of this article solely reflects the author's opinion and does not represent the platform in any capacity. This article is not intended to serve as a reference for making investment decisions.
You may also like
What are the five major changes that Beam Chain will bring to Ethereum?
Beam Chain is not a new blockchain in the literal sense, but rather a new infrastructure built within the Ethereum mainnet that will significantly enhance the transaction speed, security, and efficiency of the L1 mainnet.

Staking Ethereum: BitMine's Ultimate Plan to Survive the Market
Solana and XRP ETFs resist as Bitcoin faces record withdrawals
Brutal Correction Hits Speculative Crypto Sectors