Bitcoin ( BTC ) analysis has mapped out key BTC price levels to watch going into the weekend, with a focus on the yearly open above $93,000.
Key takeaways:
Key Bitcoin price levels above and below the spot price are here as BTC is about to close the week.
The weekly close makes reclaiming $93,000 all the more important to confirm the recovery.
 BTC/USD one-hour chart. Source: Cointelegraph/ TradingView
Onchain data reveals key levels to watch
Bitcoin may have delivered an impressive bounce from $84,000 to start the week, but the bullish sentiment was dampened by supplier congestion from the yearly open around $93,000.
Data from CryptoQuant shows that the BTC/USD pair is trading below the average realized price (cost basis) of most age groups, signalling instability, according to CryptoQuant analyst Darkfost.
Related: Bitcoin unlikely to replicate January’s surge to new high: 21Shares founder
“The first area we want Bitcoin to reclaim is the realized price of the youngest LTH band,” Darfost said in an X post on Friday, referring to the cost basis of six to 12-month-old BTC holders around $97,000.
“This level marks the transition between STH and LTH,” the analyst wrote, adding:
“Breaking above it would put those investors back into a comfortable position, restoring their expectations of potential gains and encouraging them to keep holding rather than selling, which will bring some stability.”
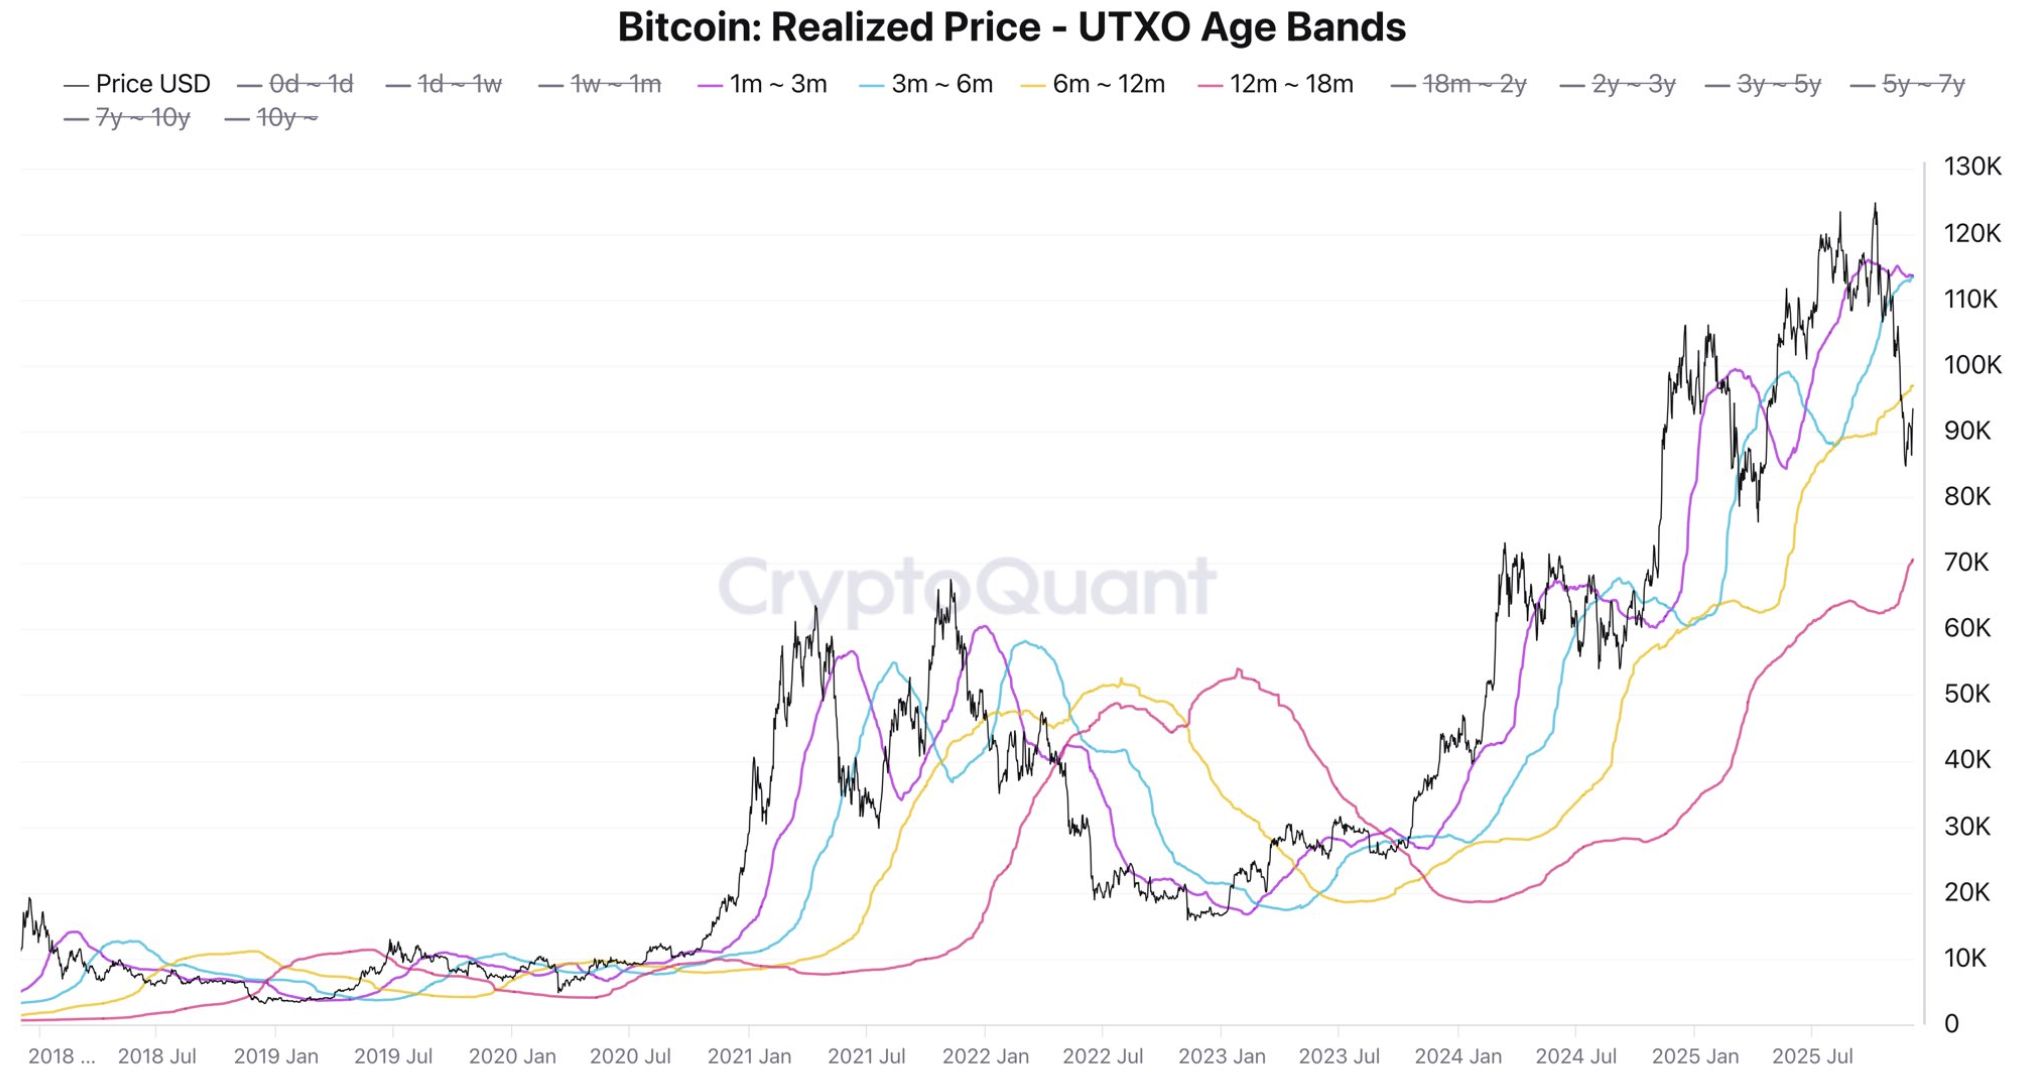 Bitcoin: Realized price, UTXO age bands. Source: CryptoQuant
Failure to close above $97,000 would mean “caution remains necessary,” Darkfost added.
On the downside, the first major support sits at $88,000, representing the lower range of BTC’s price action on higher time frames, according to analyst Daan Crypto Trades.
$BTC Has retaken the previous range with this bounce.
— Daan Crypto Trades (@DaanCrypto) December 4, 2025
Still a lot of work to do but at least the insane selling has stalled for the time being.
Ideally this doesn't lose that ~$88K region again on the higher timeframes. https://t.co/d2MWZWpixn pic.twitter.com/TszeyRGfyF
As Cointelegraph reported , a break and close below the $93,000 boundary at $91,000 would confirm the continuation of the downtrend toward $68,000.
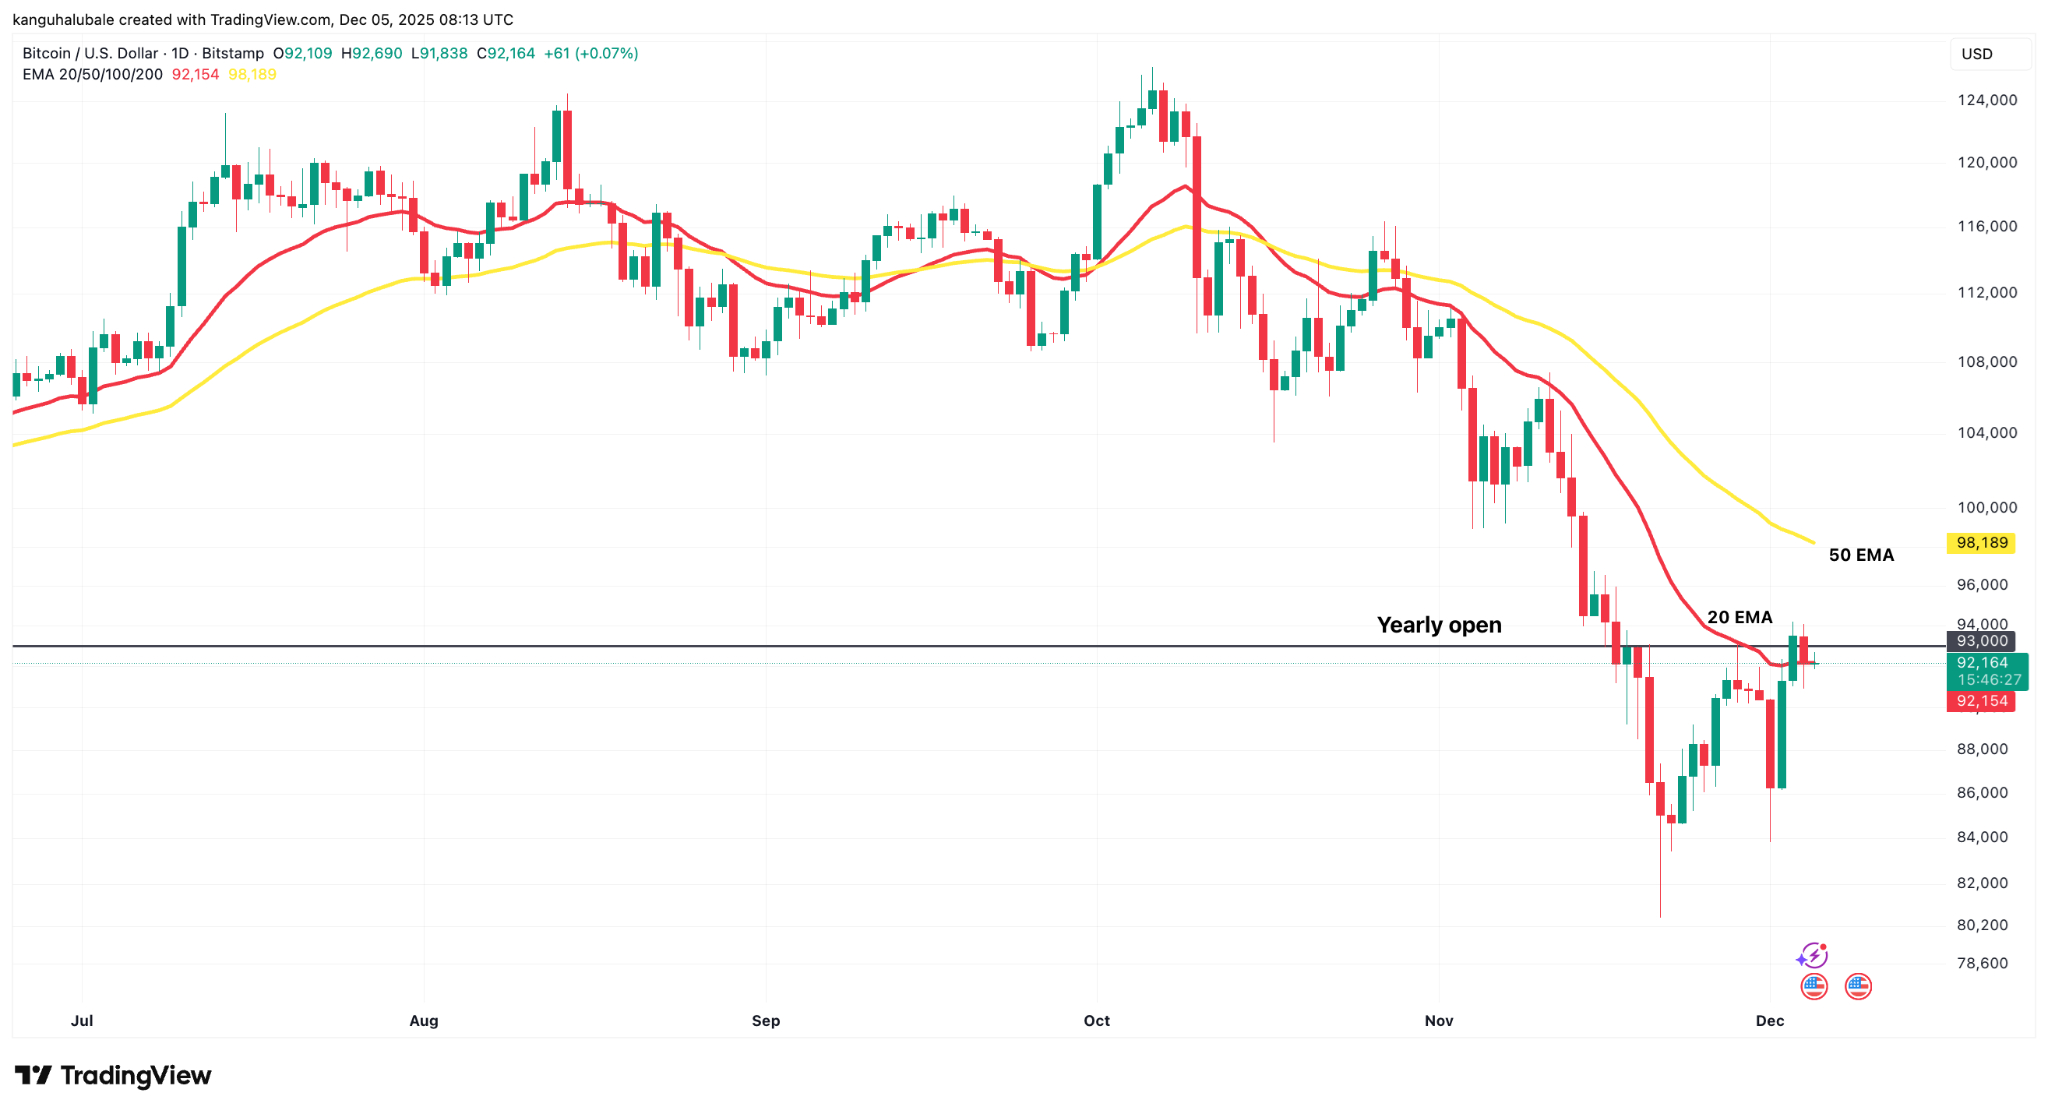
Bitcoin bulls must close the week above $93,000
Data from Cointelegraph Markets Pro and TradingView showed BTC/USD hovering below, fighting to hold $92,000.
This meant that the price remained suppressed below the yearly open of above $93,000.
This coincides with the “high range resistance at $93,500,” said analyst Rekt Capital in a recent post on X, adding:
“A weekly close above $93,500 and post-breakout retest of this level into new support (just like in previous green circles) would confirm the range breakout.”
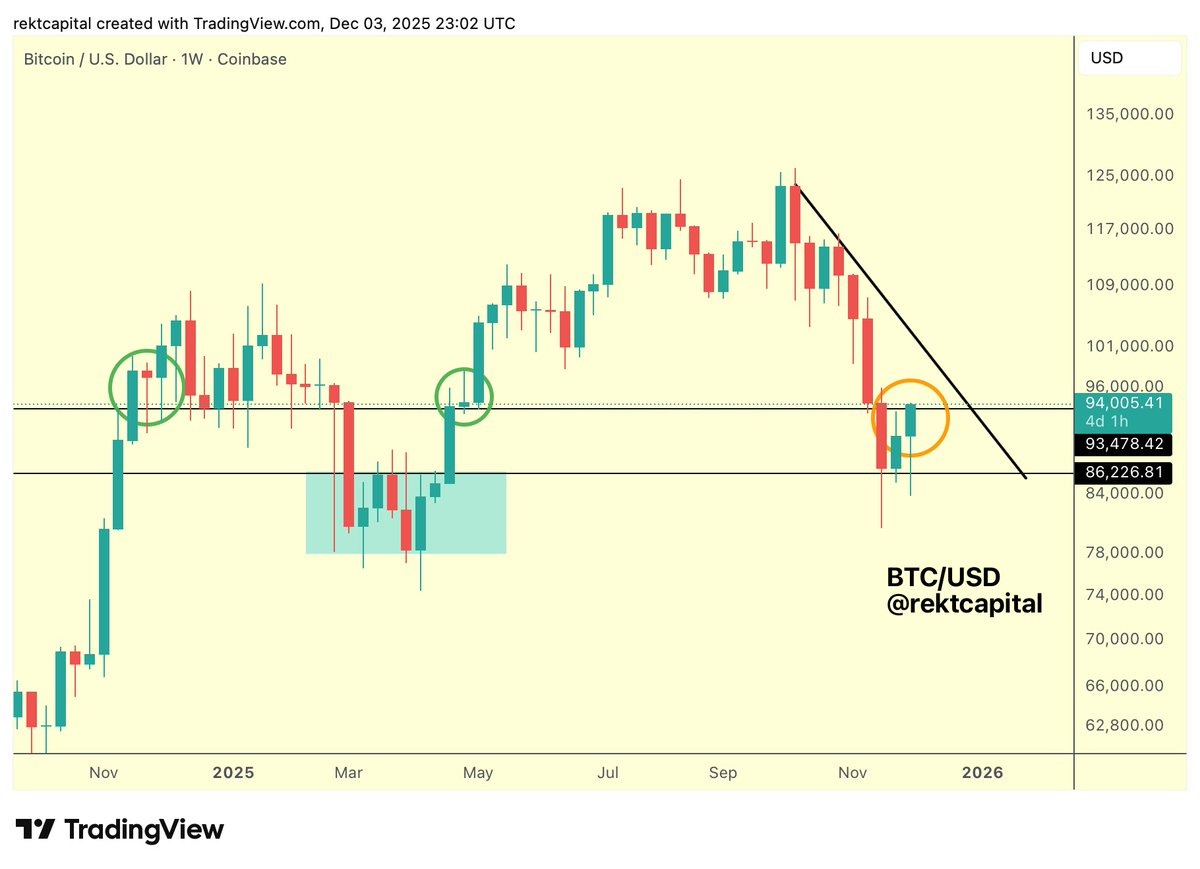 BTC/USD weekly chart. Source: Rekt Capital
Private wealth manager Swissblock said Bitcoin’s “momentum is igniting after weeks of being fully negative,” as Bitcoin fights to consolidate above the yearly open at $93,000-$93,500.
If Bitcoin holds $93,000, “the next short-term target is a break above $95K,” Swissblock added.
 Bitcoin price chart. Source: Swissblock
Fellow analyst AlphaBTC said he expected the price to rebound from the current level on the last leg up to close out the week above the yearly open, which is now acting as resistance.
As Cointelegraph reported , Bitcoin’s bearish December period could change with reduced leverage and price reclaiming key technical levels, hinting at a more stable setup.