The conversation around the Ethereum price is intensifying after ETH faced a sharp rejection from the 200-day EMA despite the U.S. Fed’s 25 bps rate cut . While many expected Ethereum crypto markets to rally on the news, Ethereum price today remains subdued , though on-chain signals point toward strengthening underlying demand.
The Ethereum price chart showed a notable rejection after touching the 200-day EMA, dropping from $3,477 to $3,192, an 8% decline, even as the Federal Reserve announced a 25 bps rate cut on December 10. Historically, such macro easing triggered a move, yet Ethereum price USD trading remained muted.
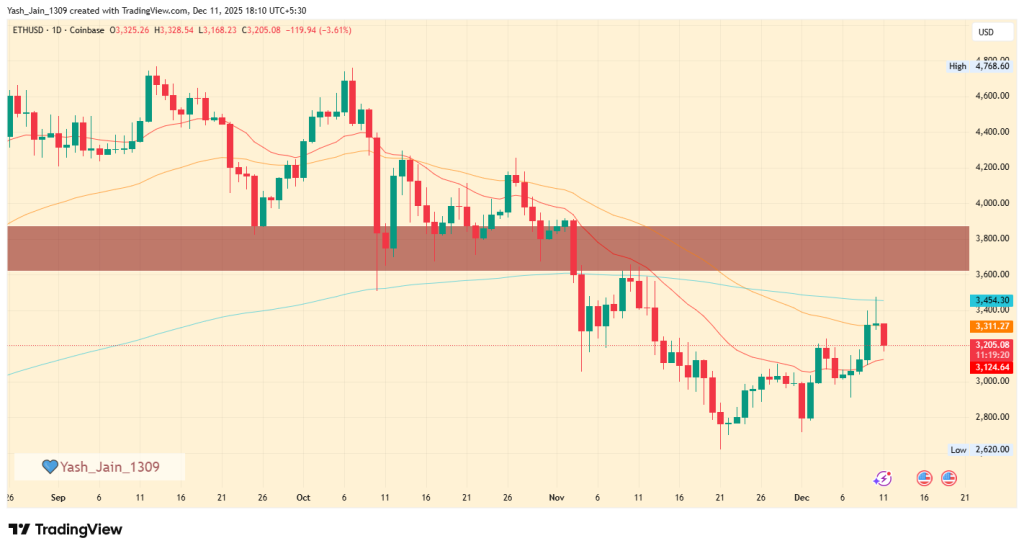
Instead of responding with a breakout, the market delivered a quiet reaction, similar to earlier periods where positive news failed to generate immediate upside. This suggests Ethereum now requires sustained demand rather than short-lived catalysts, especially with year-end liquidity typically compressing across markets.
However, deeper on-chain signals tell a different story. Whale activity shows a significant shift, with one major holder reportedly selling over $132 million in BTC and accumulating more than $140 million in ETH over two weeks. This large-scale rotation hints at growing strategic interest in Ethereum over Bitcoin for the near term.
Such whale reallocations often indicate early trend formation rather than short-term price reactions. While Ethereum price today remains near $3,200, these flows signal renewed confidence beneath the surface.
- Also Read :
- XRP Price Set to Surge as Ripple Prepares for Clarity Act Compliance
- ,
On-chain exchange netflow data shows sharply negative netflows, meaning outflows vastly exceeded inflows during that period. When ETH is withdrawn from exchanges into private wallets or staking, it reduces immediate sell pressure and supports longer-term positioning.
Importantly, this pattern does not imply sudden bullish momentum but it does show a tightening supply environment, which historically supports price stability and eventual upward shifts when demand strengthens.
Monitoring this pattern in the days ahead will be essential, as consistent negative netflows often precede accumulation phases.
Another important indicator comes from taker flows on Binance. Net Taker Volume remains negative at “–$138 million”, but this is a dramatic improvement from late October’s “–$500 million”, when aggressive sellers dominated and pushed prices down.
Now, buyer-driven taker orders are increasingly active, signaling that more traders are willing to execute immediately at market. This looks like a behavior typically associated with emerging optimism.
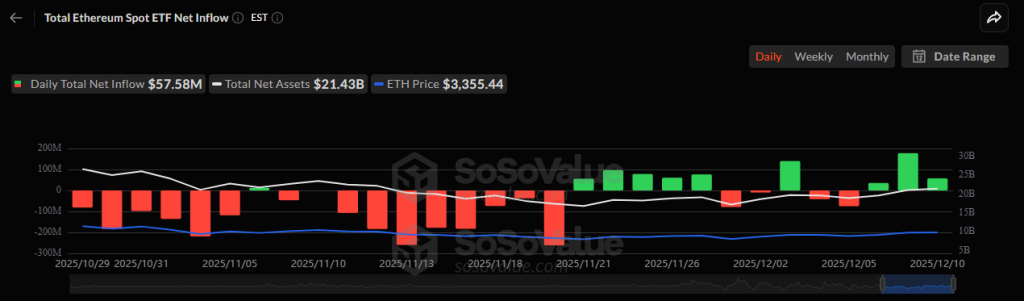
At the same time, Ethereum ETFs have recorded three consecutive days of positive inflows, showing renewed institutional participation following weeks of outflows. Now, how these signals evolve may ultimately shape the broader Ethereum price trajectory ahead.