
Bitcoin price regroups after decline—Is a directional breakout imminent?

Bitcoin price declined further, breaking below the $87,000 support level. Currently, Bitcoin is consolidating and may find it difficult to break through the $89,350 barrier.
- Bitcoin started a new round of decline after falling below the $87,500 area.
- The current price is below $88,000 and the 100-hour simple moving average.
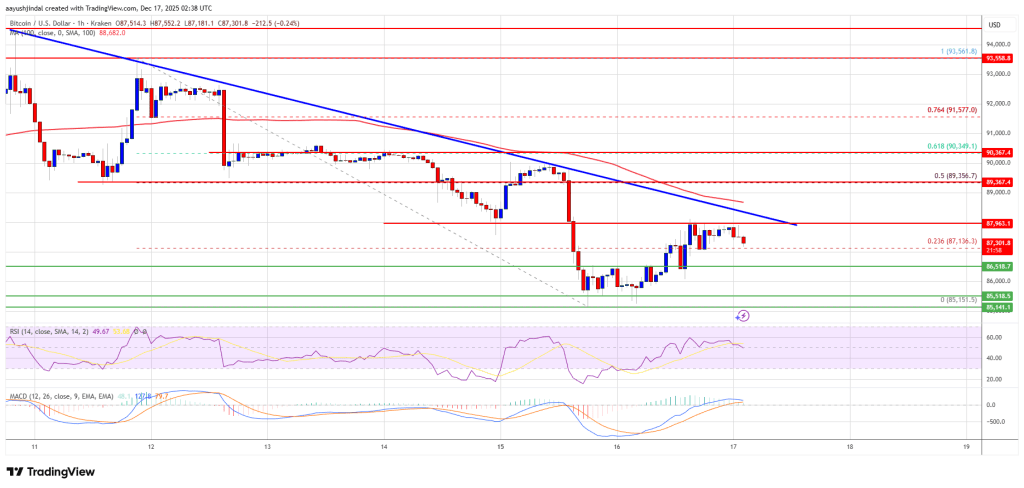
- On the BTC/USD hourly chart (data from Kraken), a bearish trend line is forming with resistance at $88,500.
- If the pair stabilizes above the $89,350 area, it may continue to rise.
Bitcoin Price Consolidates Losses
Bitcoin price struggled to stay above $89,000 and $88,500. BTC started a new round of decline and broke below the $88,000 support level.
The price even briefly fell below the $86,500 support. However, bulls became active near $85,000. The price formed a low near $85,151 and recently began a rebound correction. The price broke through the 23.6% Fibonacci retracement level of the decline from the $93,560 high to the $85,151 low.
Bears are active near $89,000. Bitcoin is currently trading below $88,000. 100-hour simple moving average If bulls remain strong, the price may rise further. Immediate resistance is near $88,000. The first key resistance is near $88,500. In addition, on the BTC/USD hourly chart, a descending trend line is forming with resistance at $88,500.
 Source: BTCUSD on TradingView.com
 The next resistance could be $89,350, or the 50% Fibonacci retracement level of the decline from the $93,560 high to the $85,151 low. If the closing price is above the $89,350 resistance, the price may rise further. In this case, the price could rise and test the $90,000 resistance. Any further gains could push the price towards $91,200. The next hurdle for the bulls may be $92,000 and $92,500.
Will Bitcoin Price Decline Again?
If Bitcoin fails to break through the $88,500 resistance, it may start a new round of decline. Immediate support is near $87,000. The first major support is near $86,500.
The next support is near $85,500. If the price continues to fall, it may further test the $85,000 support in the short term. The main support is at $83,500, and if this support is broken, Bitcoin may accelerate its decline in the short term.
Technical Indicators:
Hourly MACD – The MACD is currently slowing down in the bearish zone.
Hourly Relative Strength Index (RSI) – The RSI for BTC/USD is currently near the 50 level.
Major support levels – $85,500, followed closely by $85,500.
Major resistance levels – $88,500 and $89,350.
Disclaimer: The content of this article solely reflects the author's opinion and does not represent the platform in any capacity. This article is not intended to serve as a reference for making investment decisions.
You may also like
Traders ponder a bottom as Bitcoin falls back to this week's lows below $86,000

Scor Protocol Expands Web3 Gaming Platform to Mantle Network to Advance Scalability and Cross-Chain Interoperability
Bitcoin miner Hut 8 signs $7 billion AI deal backed by Google