The 7 U.S. Market Indices Every Trader Should Know — And How to Trade Them on Bitget (2026 Guide)
Whether you're a crypto-native trader expanding into traditional finance or a TradFi investor looking for higher leverage and 24-hour access, U.S. market indices are the most-watched financial instruments on the planet. This guide breaks down the 7 key U.S. indices and instruments, explains exactly which ones you can trade on Bitget — and how.
Key Takeaways
-
The Four Major U.S. Equity Indices Cover the Full Market Spectrum: The S&P 500 (SPX), Nasdaq 100 (NAS100), Dow Jones (DJIA), and Russell 2000 each track a different slice of the American economy — from blue-chip industrials to high-growth tech to small-cap domestic stocks.
-
The VIX and ETFs Add a Sentiment and Liquidity Layer: The VIX is the market's "fear gauge," signaling risk appetite across all asset classes including crypto. SPY and QQQ are the world's two largest ETFs by AUM, offering direct exposure to the S&P 500 and Nasdaq 100 respectively.
-
-
U.S. Index Trading on Bitget Is Fully Crypto-Native: All margin and settlement is handled in USDT — no fiat banking required. Bitget offers up to 500× leverage on index CFDs, versus the typical 20×–100× cap at regulated traditional brokers.
What Is a Market Index?
A market index is a statistical measure that tracks the collective performance of a selected group of assets, typically stocks, to represent the health of a broader market, sector, or economy. Instead of monitoring thousands of individual securities, traders and investors use indices as a single reference point to gauge market direction, benchmark portfolio returns, and identify macroeconomic trends.
The index itself is not a tradeable asset. It is a calculated number, updated in real time, that reflects the aggregate price movement of its constituent stocks. To gain exposure to an index, traders use financial instruments such as ETFs, CFDs, futures contracts, or tokenized assets that track its value.
How Indices Are Calculated
The way an index weights its components determines how sensitive it is to individual stock movements. The three most common methodologies are market-capitalization weighting, price weighting, and equal weighting.
-
In a market-cap weighted index, larger companies have a proportionally greater influence on the index value. The S&P 500 and Nasdaq 100 both use this method, which means that a significant move in Apple, Microsoft, or Nvidia can shift the entire index more than a comparable move in a smaller constituent.
-
In a price-weighted index, stocks with higher share prices carry more weight, regardless of the company's overall size. The Dow Jones Industrial Average uses this approach, which is why a sharp move in a high-priced stock like UnitedHealth Group can have an outsized effect on the index.
-
In an equal-weighted index, every constituent is assigned the same influence on the index value, regardless of company size or share price. This approach gives smaller companies a more representative voice in the overall reading.
| Weighting Method |
How It Works |
Example |
| Market-Cap Weighted |
Larger companies have greater influence on the index value |
S&P 500, Nasdaq 100 |
| Price-Weighted |
Higher-priced stocks carry more weight, regardless of company size |
Dow Jones Industrial Average |
| Equal-Weighted |
Every constituent has the same influence on the index |
Russell 2000 |
Why Indices Matter Beyond Stocks
Market indices are not just tools for equity investors. They function as macro signals for traders across all asset classes, including cryptocurrency. When the S&P 500 sells off sharply, risk appetite typically contracts across global markets and crypto is not immune. When the VIX spikes, it signals that institutional traders are pricing in elevated uncertainty, which often precedes broader market volatility.
Understanding how these indices move, and why, gives any trader regardless of their primary market a more complete picture of the global risk environment.
Which U.S. Indices You Can Trade on Bitget
Bitget provides access to six major U.S. equity indices through a combination of CFD contracts, perpetual futures, and tokenized assets. Each instrument is settled in USDT, requires no traditional brokerage account, and is available to traders around the clock on trading days.
1. S&P 500 — US500
The S&P 500 tracks 500 of the largest publicly traded companies in the United States and is widely regarded as the leading benchmark for the overall U.S. equity market. It is commonly used by institutional and retail traders to assess broad market health, risk sentiment, and the performance of large-cap U.S. stocks.
On Bitget, the S&P 500 is available as the US500 CFD, allowing traders to go long or short on the index with USDT margin and up to 500× leverage, without owning the underlying stocks.
2. Nasdaq 100 — NAS100
The Nasdaq 100 tracks the 100 largest non-financial companies listed on the Nasdaq Stock Exchange. It is heavily weighted toward technology and growth sectors, with companies such as Apple, Microsoft, Nvidia, Amazon, and Meta representing a significant share of the index. Because of this composition, the Nasdaq 100 is often more volatile than the S&P 500 and is especially sensitive to interest rate expectations, earnings results, and shifts in investor appetite for growth stocks.
On Bitget, the Nasdaq 100 is available as the NAS100 CFD, providing leveraged directional exposure with USDT margin and up to 500× leverage.
3. Dow Jones Industrial Average — US30
The Dow Jones Industrial Average is one of the oldest and most widely recognized stock market indices in the world. It tracks 30 large blue-chip U.S. companies across sectors such as finance, healthcare, consumer goods, and industrials. Unlike most major indices, the Dow is price-weighted, meaning higher-priced stocks can have a greater impact on index movements.
On Bitget, the Dow Jones is available as the US30 CFD, offering leveraged long and short exposure with USDT settlement and up to 500× leverage.
4. Russell 2000 — US2000
The Russell 2000 tracks 2,000 small-cap U.S. companies and is the most widely followed benchmark for the small-cap segment of the U.S. equity market. Because small-cap companies are often more domestically focused and more sensitive to credit conditions, the Russell 2000 can behave differently from large-cap indices such as the S&P 500 and Nasdaq 100. Traders often use it to assess the strength of the broader U.S. economy beyond mega-cap companies.
On Bitget, the Russell 2000 is available as the US2000 CFD, with USDT margin and up to 500× leverage.
5. SPY — SPYUSDT and rSPY/USDT
SPY is the ticker for the SPDR S&P 500 ETF Trust, one of the world’s largest and most liquid exchange-traded funds. It trades on the New York Stock Exchange and is designed to closely track the performance of the S&P 500.
On Bitget, SPY is available in two forms. SPYUSDT is a USDT-margined perpetual futures contract that allows traders to take long or short positions with no expiry date. rSPY/USDT is a tokenized asset that provides exposure to SPY without requiring a traditional brokerage account or direct equity market access.
6. QQQ — QQQUSDT and rQQQ/USDT
QQQ is the ticker for the Invesco QQQ Trust, an exchange-traded fund designed to track the Nasdaq 100. Because QQQ reflects the performance of the Nasdaq 100, it is commonly used by traders seeking exposure to large-cap technology and growth stocks.
On Bitget, QQQ is available in two forms. QQQUSDT is a USDT-margined perpetual futures contract that allows traders to take long or short on QQQ price movements with no expiry date. rQQQ/USDT is a tokenized asset that provides exposure to SPY without requiring a traditional brokerage account or direct equity market access.
The 7 Key U.S. Indices & Instruments Explained
The U.S. equity market is tracked by a range of indices and instruments, each constructed differently and representing a distinct slice of the market. Understanding what each one measures, how it is weighted, and what drives its movement gives traders a cleaner foundation for reading market conditions and making directional decisions.
1. S&P 500
The S&P 500 is the most widely followed benchmark of the U.S. equity market. It tracks 500 large-cap companies selected by a committee based on market capitalization, liquidity, and financial viability, spanning sectors from technology and healthcare to energy and financials. Because it is market-cap weighted, the largest companies, including Apple, Microsoft, Nvidia, Amazon, and Alphabet, carry the most influence over the index reading. The S&P 500 is the standard reference point for institutional portfolio benchmarking and is the index most traders refer to when they say "the market."
2. Nasdaq 100
The Nasdaq 100 tracks the 100 largest non-financial companies listed on the Nasdaq Stock Exchange. Its composition is heavily weighted toward technology and growth sectors, making it the most tech-concentrated of the major U.S. indices. It is more volatile than the S&P 500 and particularly sensitive to interest rate expectations, earnings results from large-cap tech companies, and shifts in risk appetite. When technology leads the market, the Nasdaq 100 tends to outperform. When rates rise or growth sentiment deteriorates, it tends to underperform.
3. Dow Jones Industrial Average
The Dow Jones Industrial Average is one of the oldest equity indices in the world, tracking 30 large blue-chip U.S. companies across industries including finance, healthcare, consumer goods, and industrials. Unlike the S&P 500 and Nasdaq 100, the Dow is price-weighted, meaning stocks with higher share prices carry greater influence on the index regardless of overall company size. It is widely cited in financial media but is considered a narrower and less representative measure of the broad market than the S&P 500.
4. Russell 2000
The Russell 2000 tracks 2,000 small-capitalization U.S. companies and is the primary benchmark for the small-cap segment of the U.S. equity market. Because small-cap companies tend to be more domestically focused and more sensitive to credit conditions and economic cycles, the Russell 2000 often diverges from large-cap indices during periods of macro stress, dollar strength, or tightening financial conditions. Traders use it to assess the breadth of the U.S. economic expansion beyond the largest corporations. A rising Russell 2000 alongside a rising S&P 500 is generally read as a sign of broad market health. Divergence between the two often signals underlying weakness.
5. VIX
The VIX, formally known as the CBOE Volatility Index, is not a stock index. It is a measure of expected volatility in the S&P 500 over the next 30 days, derived from the pricing of S&P 500 options. A low VIX reading, typically below 15, indicates that market participants expect calm conditions. A high VIX reading, above 25 or 30, signals elevated fear or uncertainty. The VIX is often referred to as the fear gauge. It tends to spike sharply during market sell-offs and compress during sustained uptrends. Traders across all asset classes monitor the VIX because rising volatility expectations in U.S. equities frequently precede broader risk-off moves in global markets, including crypto.
6. SPY
SPY is the ticker for the SPDR S&P 500 ETF Trust, the largest exchange-traded fund in the world by assets under management. It is designed to replicate the performance of the S&P 500 by holding the same 500 constituent stocks in proportion to their index weight. SPY trades on the New York Stock Exchange like a regular stock, which means it can be bought, sold, and shorted throughout the trading session. Because of its size and liquidity, SPY is one of the most heavily traded securities in the world and is widely used by institutional traders to gain or hedge broad market exposure quickly.
7. QQQ
QQQ is the ticker for the Invesco QQQ Trust, an ETF that tracks the Nasdaq 100. It is the equity instrument of choice for traders seeking leveraged or directional exposure to the technology and growth sectors without constructing a portfolio of individual stocks. QQQ is one of the most actively traded ETFs in the world and is closely watched as a real-time proxy for Nasdaq 100 sentiment. Movements in QQQ during premarket and after-hours sessions are often used to gauge how the broader tech sector is likely to open.
How to Read U.S. Indices
Reading a U.S. index correctly means understanding not just the number on the screen, but what that number represents, how it moves, and what it tells you about broader market conditions. Traders who can interpret index data accurately gain a significant edge in identifying trends, spotting warning signs, and timing entries and exits.
The Index Level Is a Composite Score
An index does not have a price in the same way a stock does. It is a calculated number derived from the prices of its constituent companies, weighted according to its construction methodology. When the S&P 500 reads 5,400, that figure represents the aggregate weighted value of 500 companies, scaled to a base value established decades ago.
What matters to traders is not the absolute level but the direction, magnitude, and speed of change relative to recent history. A reading of 5,400 is only meaningful when compared to where the index was yesterday, last week, and at its prior peak or trough.
Price Change and Percentage Move
The most immediate reading on any index is the daily price change and the percentage move. A 50-point move on the S&P 500 carries a very different significance at 1,000 than it does at 5,400. The percentage change is always the more meaningful figure because it normalizes the move relative to the current index level.
| Daily % Move |
What It Signals |
| Below 0.5% |
Quiet, low-conviction session |
| 0.5% to 1.0% |
Normal directional day |
| 1.0% to 2.0% |
Elevated activity; watch for follow-through |
| Above 2.0% |
High volatility; trend day or reversal risk |
| Above 3.0% |
Crisis-level move; macro event or systemic shock |
Reading the Indices Together
No index should be read in isolation. Professional traders monitor multiple indices simultaneously because the relationships between them reveal information that a single chart cannot. Divergences between indices are often more informative than the movement of any one index on its own.
-
S&P 500 vs. Nasdaq 100
When the Nasdaq 100 outperforms the S&P 500, technology and growth stocks are leading the market. When the S&P 500 holds up but the Nasdaq 100 lags, it signals rotation out of tech into defensive or value sectors. This divergence is frequently one of the earliest visible signals of a broader sentiment shift.
-
S&P 500 vs. Russell 2000
When both indices rise together, market breadth is healthy and the rally has broad participation across company sizes. When the S&P 500 rises but the Russell 2000 lags or declines, gains are concentrated in large-cap names and the market is narrower than headline numbers suggest. Sustained divergence between the two is a classic warning sign that a rally may lack durability.
-
SPY vs. QQQ
Because SPY tracks the S&P 500 and QQQ tracks the Nasdaq 100, their relative performance on any given day is a real-time measure of whether the market is in a growth-led or defensive-led mode.
-
The VIX as a Market Condition Filter
Before reading any index chart, experienced traders check the VIX. The VIX level sets the context for how to interpret everything else on the screen. It communicates not just where the market is, but how market participants feel about where it is heading.
| VIX Range |
Market Condition |
What It Means for Traders |
| Below 15 |
Low volatility, complacent |
Trends tend to be steady; breakouts may lack follow-through |
| 15 to 25 |
Normal range |
Standard trending and ranging conditions |
| 25 to 35 |
Elevated fear |
Increased intraday swings; stop placement becomes more critical |
| Above 35 |
Crisis or panic |
Extreme volatility; reversals can be sharp and fast |
Three key VIX relationships every index trader should understand:
-
Rising VIX with a falling S&P 500 confirms a genuine risk-off move. Fear and selling are aligned.
-
Falling VIX with a rising S&P 500 confirms a healthy uptrend. Confidence is building alongside price.
-
Rising VIX with a rising S&P 500 is a warning signal. The rally may be fragile or driven by short covering rather than genuine demand.
Key Levels: Support, Resistance, and Round Numbers
Index traders pay close attention to round numbers and historically significant price levels. The S&P 500 at 5,000 or 5,500, the Nasdaq 100 at 20,000, and the Dow at 40,000 all function as psychological reference points where buying and selling pressure tends to cluster.
Beyond round numbers, the key structural levels to track are:
-
Prior all-time highs, which frequently become support after a confirmed breakout above them.
-
Major swing lows, which define the floor of the prevailing trend.
-
The 50-day moving average, widely watched by institutional traders as a medium-term trend filter.
-
The 200-day moving average, the single most important long-term trend indicator. A sustained break below it is considered a significant bearish development.
Time of Day and Session Context
U.S. equity indices do not move uniformly throughout the trading day. Price action quality and volume vary considerably across different session windows, and understanding these patterns helps traders avoid low-quality setups.
| Session Window |
Time (ET) |
Characteristics |
| Pre-market |
4:00 to 9:30 AM |
Low liquidity; futures and ETF price discovery |
| Market open |
9:30 to 10:30 AM |
Highest volatility; overnight gaps absorbed here |
| Midday |
11:30 AM to 2:00 PM |
Volume drops; choppy, less directional price action |
| Power hour |
3:00 to 4:00 PM |
Volume surges; institutional position adjustment before close |
| After-hours |
4:00 to 8:00 PM |
Earnings reactions; lower liquidity than regular session |
The opening 30 minutes and the final hour of the session carry the most analytical weight. The midday period is generally the least reliable window for trend-following entries.
Premarket Futures as a Leading Indicator
U.S. index futures trade nearly 24 hours a day, well before the equity market opens. Traders monitor S&P 500 and Nasdaq 100 futures during Asian and European sessions to assess how the U.S. market is likely to open. Two patterns are particularly instructive:
A strong overnight futures rally that fades into the open often signals weak follow-through and potential intraday reversal. A gap down that is immediately bought at the open can signal strong underlying demand and a potential trend day higher.
How to Trade U.S. Indices on Bitget
Bitget provides access to U.S. equity index markets through three product types: CFD contracts, perpetual futures, and tokenized assets. All instruments are USDT-settled, require no traditional brokerage account, and are available to traders around the clock on trading days.
Index CFDs (US500, NAS100, US30, US2000)
Bitget's index CFDs are available through its TradFi infrastructure powered by MT5 technology. This covers the S&P 500 (US500), Nasdaq 100 (NAS100), Dow Jones Industrial Average (US30), and Russell 2000 (US2000). CFDs allow traders to go long or short on an index without owning any underlying asset, with profit and loss calculated on the price difference between entry and exit.
-
Step 1: Create and Verify Your Bitget Account
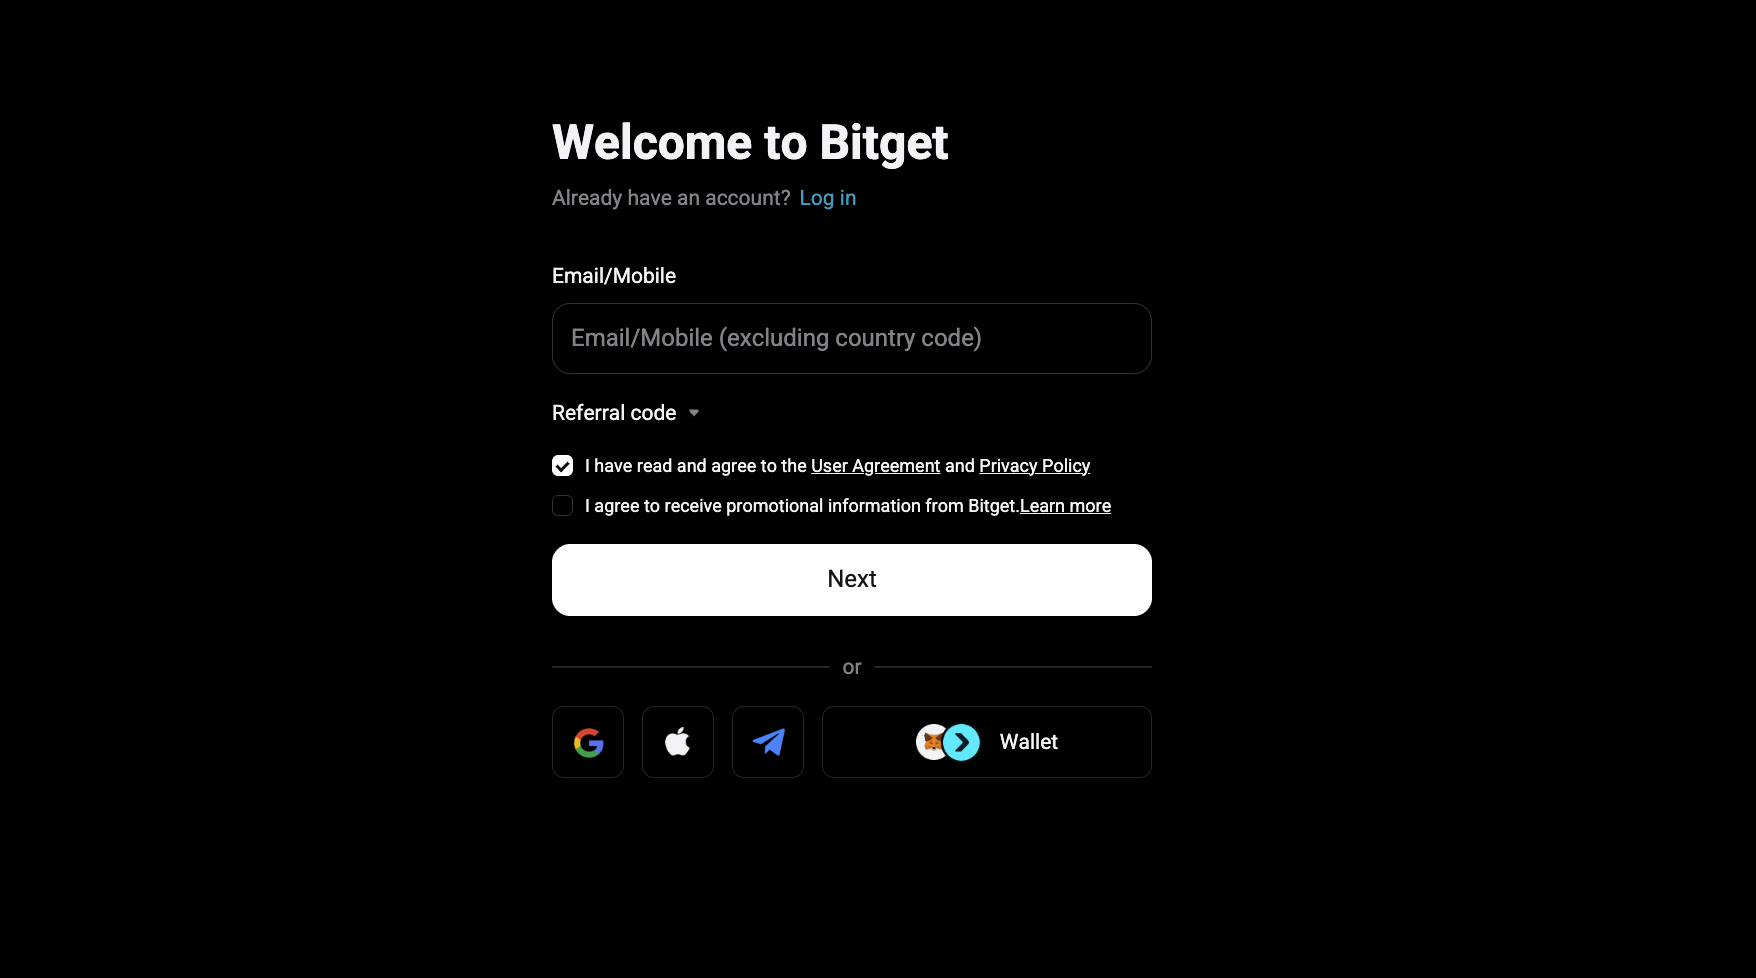
Sign up for a Bitget account and complete the KYC verification process. TradFi access may require additional verification steps depending on your region.
-
Step 2: Activate a TradFi / MT5 Trading Account
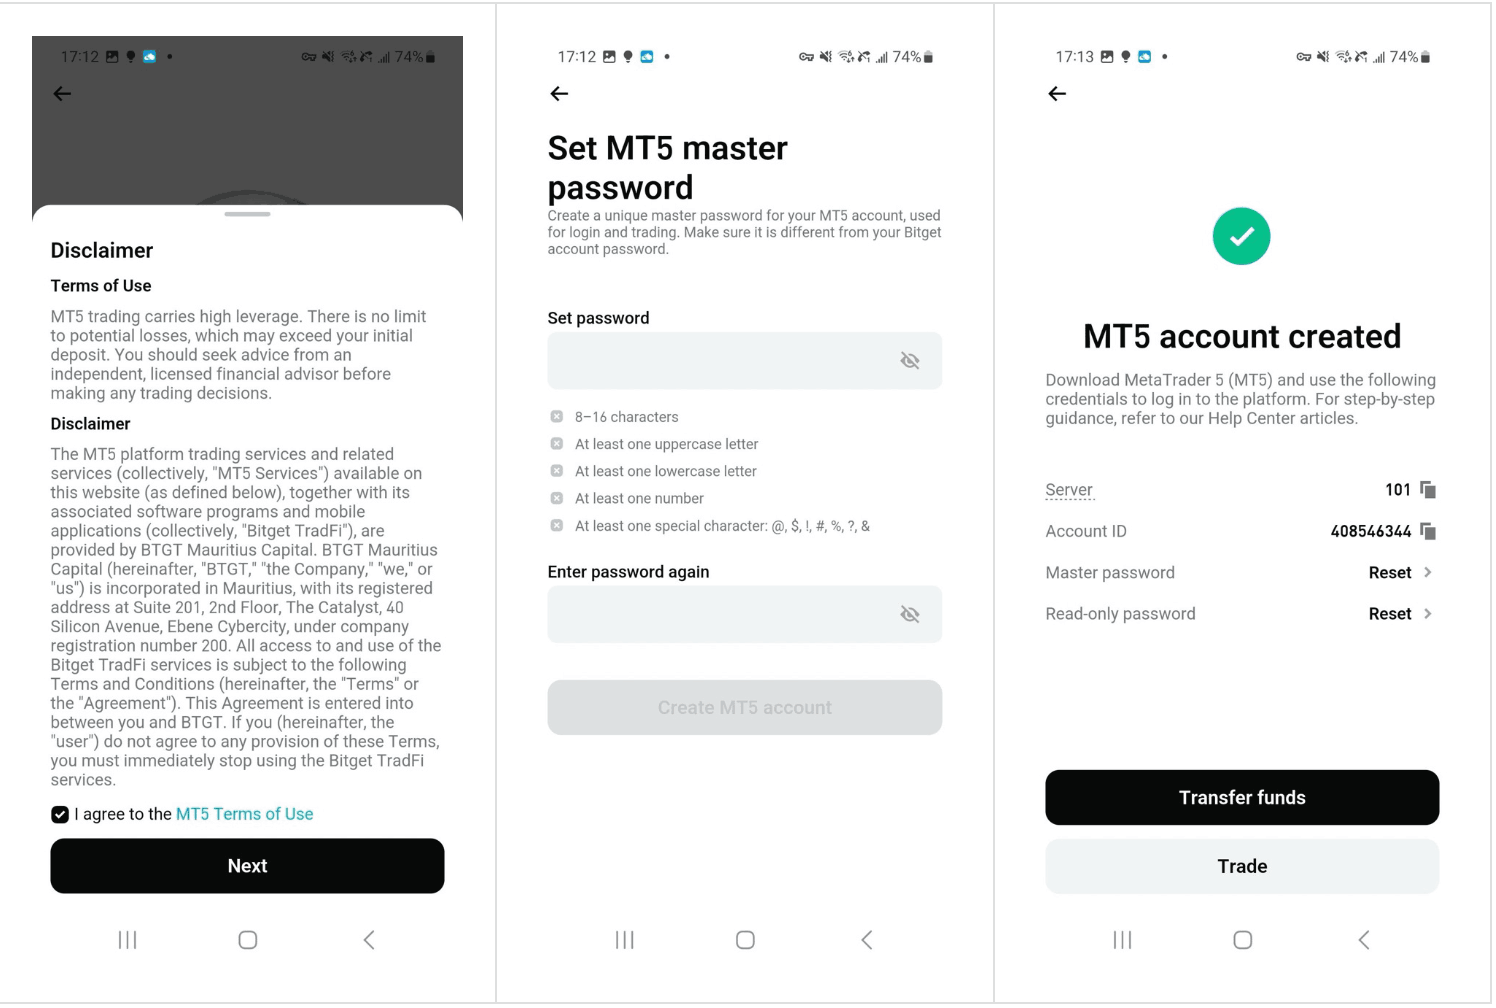
Index CFD trading is available through Bitget's TradFi section. Navigate to Futures, then select CFD, and create your MT5 account by following the on-screen setup instructions.
-
Step 3: Deposit and Transfer USDT
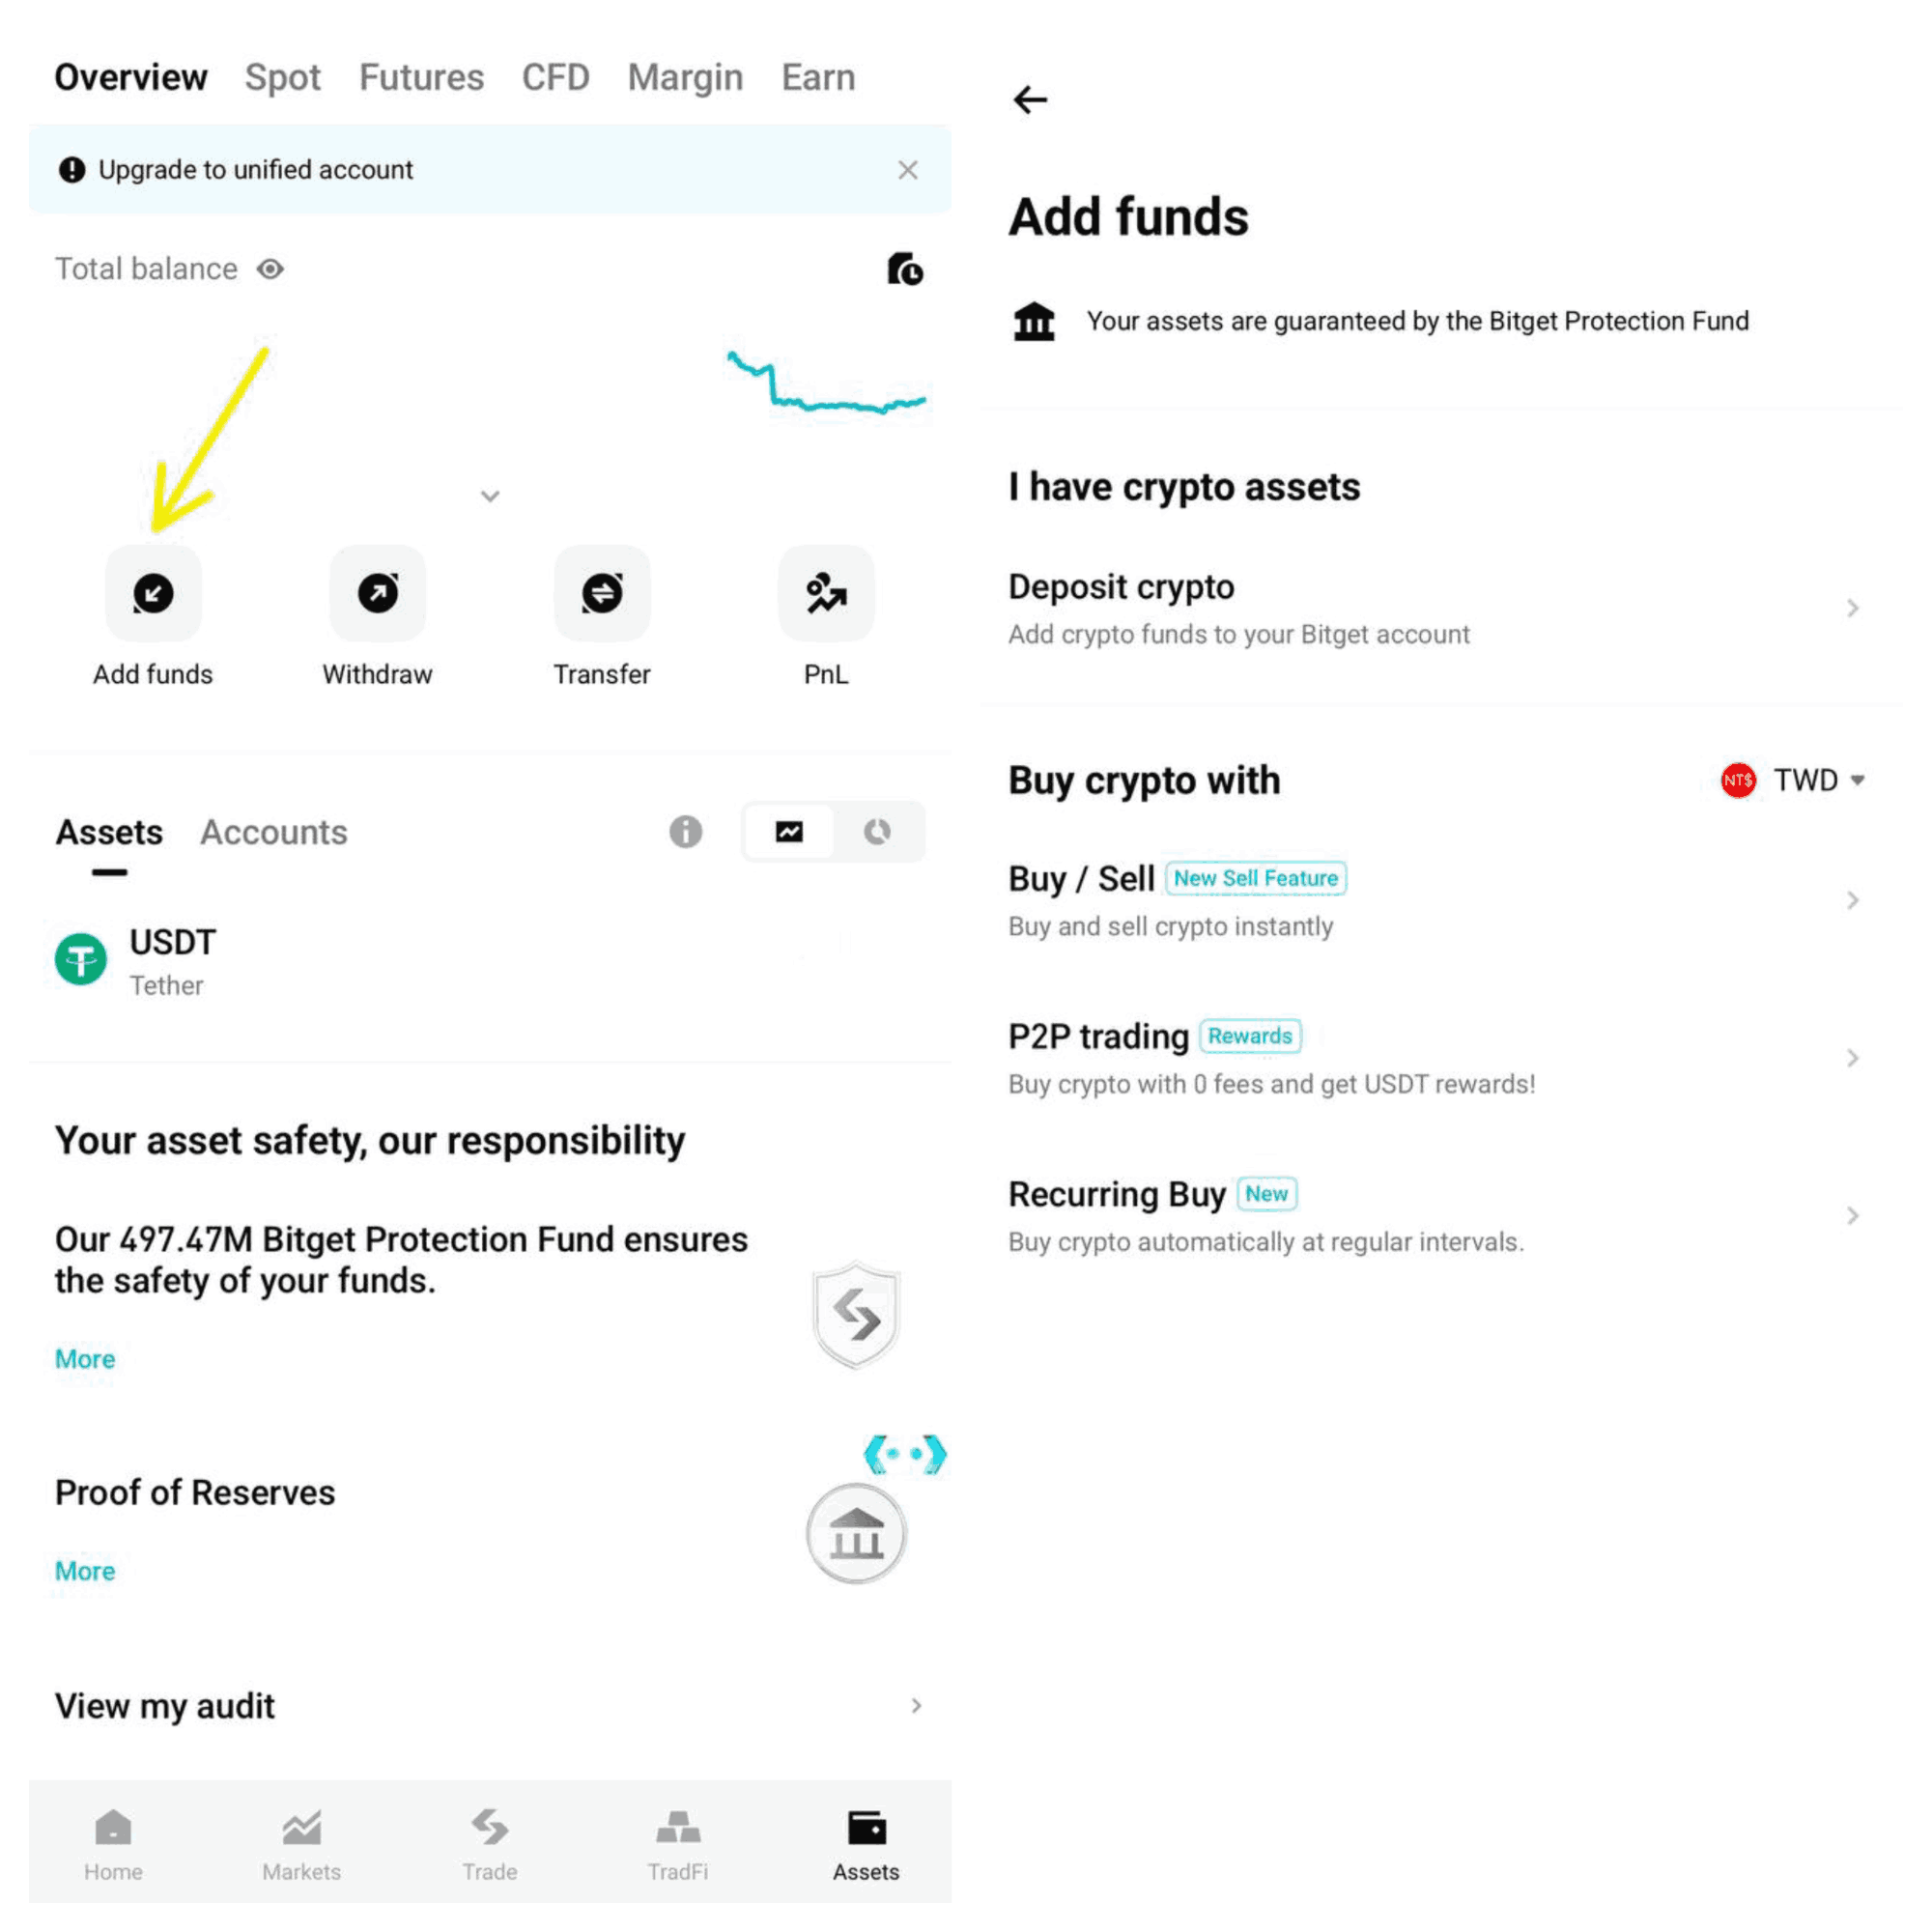
Fund your Bitget account using USDT, then transfer the funds into your TradFi account. Because Bitget uses USDT-based settlement throughout, you can trade U.S. indices without needing fiat currency or a traditional brokerage.
Read more: Bitget Deposit Guide
-
Step 4: Select Your Index Instrument
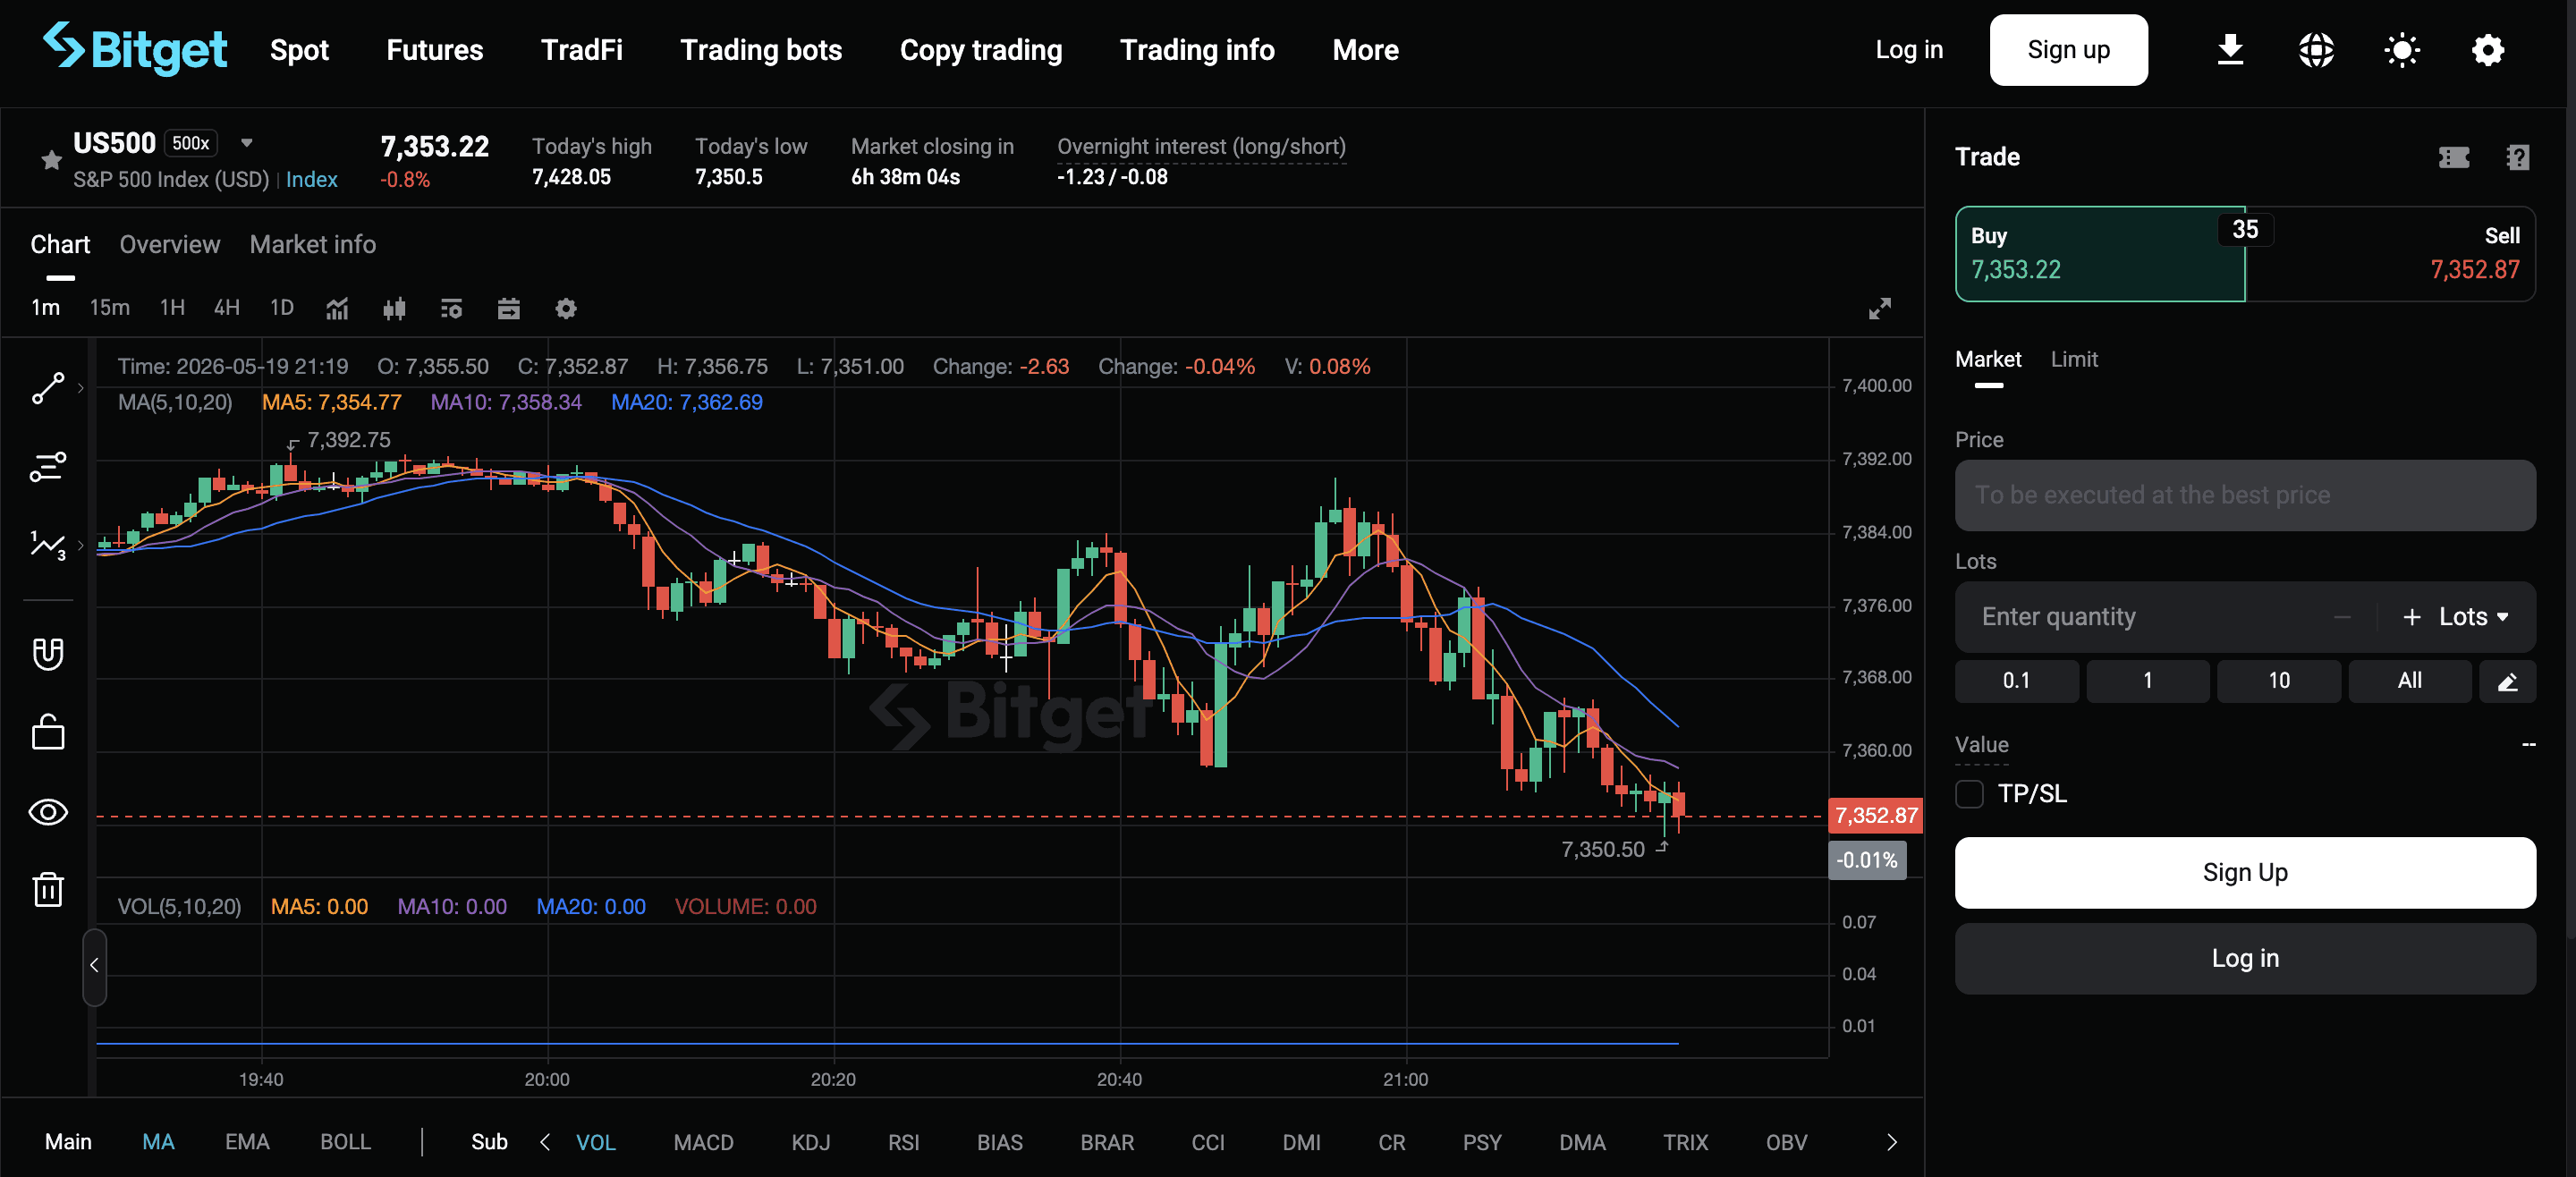
Navigate to the index trading section and search for your chosen instrument. Before opening a trade, review the current price, available leverage, margin requirements, spread, and prevailing market conditions.
-
Step 5: Set Leverage
Choose your leverage level before opening the trade. Bitget supports up to 500x leverage on index CFDs. The appropriate level depends on your stop loss distance and overall risk tolerance.
-
Step 6: Open and Manage Your Trade
Choose your direction, position size, and order type before confirming. Long positions profit when the index rises. Short positions profit when the index falls. Set your stop loss and take profit levels at the time of entry and manage your exposure through the MT5 interface.
Perpetual Futures (SPYUSDT and QQQUSDT)
The perpetual futures contract gives traders leveraged exposure to the Nasdaq 100 with no expiry date. Unlike CFDs, perpetual futures carry a funding rate that is exchanged between long and short holders at regular intervals, which affects the cost of holding a position overnight.
-
Step 1: Access the Futures Trading Platform
Log in to your Bitget account and navigate to the Futures tab. From the dropdown, select the relevant futures category to access USDT-margined index perpetual contracts.
-
Step 2: Select SPYUSDT or QQQUSDT
Locate SPYUSDT or QQQUSDT from the list of available instruments. Review the current price, funding rate, open interest, and 24-hour volume before proceeding.
-
Step 3: Set Leverage
Choose your desired leverage level. Beginners are advised to start at lower leverage to manage risk while learning how the product behaves during volatile sessions.
-
Step 4: Choose Direction and Order Type
Select long if you expect the Nasdaq 100 to rise, or short if you expect it to fall. Choose between a market order for immediate execution or a limit order to enter at a specific price.
-
Step 5: Set Stop Loss and Take Profit
Before confirming the trade, define your stop loss and take profit levels. This enforces your risk parameters automatically without requiring continuous position monitoring.
-
Step 6: Confirm and Monitor
Execute the trade and track it through your Futures Dashboard. Key figures to monitor include unrealized P&L, liquidation price, funding rate accrual, and current margin level.
Tokenized Assets (rSPY and rQQQ)
rSPY and rQQQ trade like a crypto spot pair on-chain, carries no expiry date, and does not use a funding rate mechanism. rSPY and rQQQ are suited to traders who want straightforward long exposure to the S&P 500 without leverage complexity.
-
Step 1: Create and Verify Your Bitget Account
Complete KYC verification to unlock tokenized asset trading on the platform.
-
Step 2: Deposit USDT
Tokenized assets on Bitget are USDT-settled. Deposit USDT into your account directly or transfer from another wallet or exchange.
-
Step 3: Access the Spot Trading Section
Hover over the Trade menu at the top of the Bitget interface. From the dropdown, select Spot.
-
Step 4: Find rSPY or rQQQ
Inside the spot trading interface, use the search bar to locate rSPY or rQQQ. Click on the trading pair to open the chart view, order panel, and market data.
-
Step 5: Choose Order Type and Amount
Place a market order for immediate execution at the current price, or a limit order to buy at a specific price level. Enter the USDT amount you want to invest.
-
Step 6: Confirm and Execute
Review the order details and confirm. Your tokens will appear in your Bitget wallet once the trade executes.
Bitget U.S. Market Indices Trading Fees Explained
Bitget applies a transparent, crypto-native fee structure for U.S. index products, making it straightforward for traders to understand costs before entering a position. Fees differ depending on whether you trade tokenized assets, perpetual futures, or CFD contracts.
Tokenized Asset Fees (rSPY and rQQQ)
-
Standard spot trading fee: 0.1% maker / 0.1% taker
-
Additional discounts available for VIP tiers or BGB token fee payments
-
No traditional brokerage commissions or fiat conversion fees
Perpetual Futures Fees (SPYUSDT and QQQUSDT)
-
Futures trading fees: 0.02% maker / 0.06% taker
-
Trading fee discounts may apply depending on active promotions. For example, from May 1, 00:30 (UTC+8), VIP users (VIP0 to VIP7) receive a 0% maker fee and a 30% discount on taker fees for stock perpetual futures
-
Funding rates applied periodically based on market conditions
-
Leverage-dependent margin requirements apply
CFD Fees (US500, NAS100, US30, US2000)
Bitget index CFD costs may include trading commissions, swap fees, spreads, and dividend adjustments. Always review the live contract specifications on Bitget before opening a position.
-
Trading Commissions
Commissions are charged when opening a position, calculated as:
Commission = number of lots x commission per lot
| Index CFD |
Max Leverage |
Commission (VIP2 and below) |
Commission (VIP3 and above) |
| US30, NAS100, US500, US2000 |
Up to 500:1 |
$3.00 per lot |
$2.70 per lot |
-
Swap Fees
Swap fees apply when a position is held past the daily cut-off time (12:00 AM MT5 server time). Rates vary by product and direction. Some instruments apply a three-day swap to cover weekend financing. Check swap long, swap short, and weekend conditions before holding overnight.
-
Dividend Adjustments
When index components pay dividends, an adjustment may be credited to long positions or debited from short positions. Check trading notices before holding positions around dividend events.
-
Zero-Fee Account Mode
From June 8, 2026, traders can switch between ECN mode and zero-fee mode. Zero-fee mode removes trading commissions, with costs reflected in the spread instead. ECN mode offers tighter spreads with the standard commission structure.
What Are the Advantages of Trading U.S. Indices on Bitget?
Trading U.S. indices on Bitget combines the accessibility of a crypto-native platform with the depth and liquidity of the world's most followed financial markets. Bitget offers several structural advantages worth understanding before you start.
Access to Multiple Product Types in One Platform
Bitget offers U.S. index exposure through CFDs, perpetual futures, and tokenized assets. Traders can choose the structure that best fits their strategy, whether that is a leveraged CFD trade on US500, a perpetual futures position on SPYUSDT and QQQUSDT, or a tokenized holding in rSPY or rQQQ, all under one account.
High Leverage With Flexible Risk Controls
U.S. index CFDs support leverage of up to 500:1, with built-in risk management tools including stop-loss orders, take-profit orders, and margin alerts. Traders can define their maximum risk before entering any position.
Transparent and Competitive Fee Structure
CFD traders pay a straightforward per-lot commission with no hidden charges, while perpetual futures traders benefit from low maker fees of 0.02%. The zero-fee CFD account mode launching June 8, 2026 allows traders to switch between ECN mode and zero-fee mode based on their preferred cost structure.
USDT Settlement Removes Fiat Friction
All index products settle in USDT, eliminating currency conversion costs and settlement delays common on traditional brokerages. Traders can move capital between index trades and other asset classes without leaving the Bitget ecosystem.
24-Hour Market Access
U.S. index CFDs and perpetual futures are accessible outside traditional exchange hours, giving traders in Asia-Pacific and European time zones the flexibility to react to news events, earnings releases, and macroeconomic data as they happen.
Integrated Trading Environment
Bitget integrates charting tools, order management, and portfolio tracking in a single interface. The MT5 integration for CFD products also gives experienced traders access to advanced charting, automated strategies, and a familiar professional trading environment.
VIP Tier Benefits and Promotions
Active traders benefit from Bitget's VIP tier system, which reduces per-lot CFD commissions, lowers futures taker fees, and unlocks periodic promotions. Holding BGB tokens provides additional fee discounts across spot and tokenized asset products.
Conclusion
The world's biggest markets are no longer reserved for institutional desks or traditional brokerage accounts. The S&P 500, Nasdaq 100, Dow Jones, and Russell 2000 move trillions of dollars every single day, and every one of those moves tells a story about where the economy is heading, which sectors are winning, and where the next opportunity might emerge.
Bitget puts all of that within reach. Through CFDs, perpetual futures, and tokenized assets, traders can engage with these markets on their own terms, whether that means riding a Fed announcement, positioning ahead of earnings season, or simply gaining exposure to the long-term growth story of the American economy, all from a single account, settled in USDT, with no fiat friction in the way.
The edge in index trading rarely comes from access alone. It comes from understanding what you are trading, why it moves, and how to manage the risk when it does not move your way. The indices covered in this guide have rewarded those who took the time to learn them and humbled those who did not.
The tools are on the platform. The markets are open. The next move is yours.
Every market move is an opportunity. Don't watch from the sidelines — join Bitget now!
Disclaimer: The opinions expressed in this article are for informational purposes only. This article does not constitute an endorsement of any of the products and services discussed or investment, financial, or trading advice. Qualified professionals should be consulted prior to making financial decisions.
Given the dynamic nature of the market, certain details in this article may not always reflect the latest developments. For any inquiries or feedback, please reach out to us at geo@bitget.com.

- Key Takeaways
- What Is a Market Index?
- Which U.S. Indices You Can Trade on Bitget
- The 7 Key U.S. Indices & Instruments Explained
- How to Read U.S. Indices
- How to Trade U.S. Indices on Bitget
- Bitget U.S. Market Indices Trading Fees Explained
- What Are the Advantages of Trading U.S. Indices on Bitget?
- Conclusion