Ethereum Price Signals A Chance For Bullish Streak To $3K
Ethereum price is showing bullish signs above the $2,720 support. ETH eyes more gains and might surge toward the $3,000 resistance zone.
- Ethereum is consolidating gains above the $2,780 support zone.
- The price is trading above $2,800 and the 100-hourly Simple Moving Average.
- There are two bullish trend lines forming with support at $2,825 and $2,780 on the hourly chart of ETH/USD (data feed via Kraken).
- The pair could continue to move up toward the $3,000 resistance zone.
Ethereum Price Eyes More Gains
Ethereum price gained pace above the $2,750 pivot level. ETH bulls were able to pump the price above the $2,800 resistance zone . It even spiked above $2,850 before the bears appeared.
A new multi-week high was formed at $2,869 before there was a downside correction, like Bitcoin . There was a minor move below the $2,850 level. Ether dipped below the 23.6% Fib retracement level of the recent wave from the $2,728 swing low to the $2,869 high.
The bulls are now active above the $2,800 level. Ethereum is now trading above $2,800 and the 100-hourly Simple Moving Average. There are also two bullish trend lines forming with support at $2,825 and $2,780 on the hourly chart of ETH/USD.
Immediate resistance is near the $2,880 level. The first major resistance is near the $2,920 level. The next major resistance is near $2,940, above which the price might rise and test the $3,000 resistance.
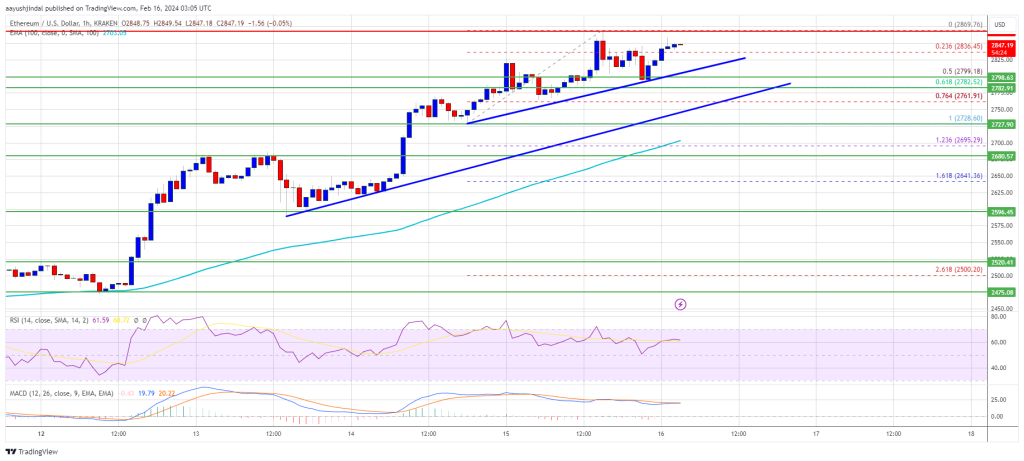
Source: ETHUSD on TradingView.com
If the bulls push the price above the $3,000 resistance, Ether could even rally toward the $3,120 resistance. In the stated case, the price could rise toward the $3,250 level.
Are Dips Supported In ETH?
If Ethereum fails to clear the $2,880 resistance, it could start a downside correction. Initial support on the downside is near the $2,825 level and the first trend line.
The next key support could be the $2,780 zone or the second trend line. It is close to the 61.8% Fib retracement level of the recent wave from the $2,728 swing low to the $2,869 high. A clear move below the $2,780 support might send the price toward $2,720. The main support could be $2,700 or the 100 hourly SMA. Any more losses might send the price toward the $2,600 level.
Technical Indicators
Hourly MACD – The MACD for ETH/USD is gaining momentum in the bullish zone.
Hourly RSI – The RSI for ETH/USD is now above the 50 level.
Major Support Level – $2,780
Major Resistance Level – $2,880
Disclaimer: The content of this article solely reflects the author's opinion and does not represent the platform in any capacity. This article is not intended to serve as a reference for making investment decisions.
You may also like
Hopes for a December rate cut fade? Bitcoin erases its yearly gains
After the release of the delayed U.S. September non-farm payroll data, which was postponed by 43 days, the market has almost abandoned expectations for a rate cut in December.

Gold Rush Handbook | Circle Arc Early Interaction Step-by-Step Guide
Remain proactive even during a sluggish market.

Mars Morning News | Nvidia's impressive earnings boost market confidence, while growing divisions in the Fed minutes cast doubt on a December rate cut
Nvidia's earnings report exceeded expectations, boosting market confidence and fueling the ongoing AI investment boom. The Federal Reserve minutes revealed increased disagreement over a possible rate cut in December. The crypto market is seeing ETF expansion but faces liquidity challenges. Ethereum has proposed EIL to address L2 fragmentation. A Cloudflare outage has raised concerns about the risks of centralized services. Summary generated by Mars AI. The accuracy and completeness of this summary are still being improved during iteration.
Surviving a 97% Crash: Solana’s Eight-Year Struggle Revealed—True Strength Never Follows the Script
Solana co-founder Anatoly Yakovenko reviewed the origins, development process, challenges faced, and future vision of Solana, emphasizing the transaction efficiency of a high-performance blockchain and the comprehensive integration of financial services. Summary generated by Mars AI. This summary was generated by the Mars AI model, and the accuracy and completeness of its content are still in the iterative update stage.