
RedStone price awaits the next catalyst as it erases recent gains, trading near key support

RedStone has erased all of its recent gains from the last major update, entering a period of consolidation as the market awaits the next catalyst.
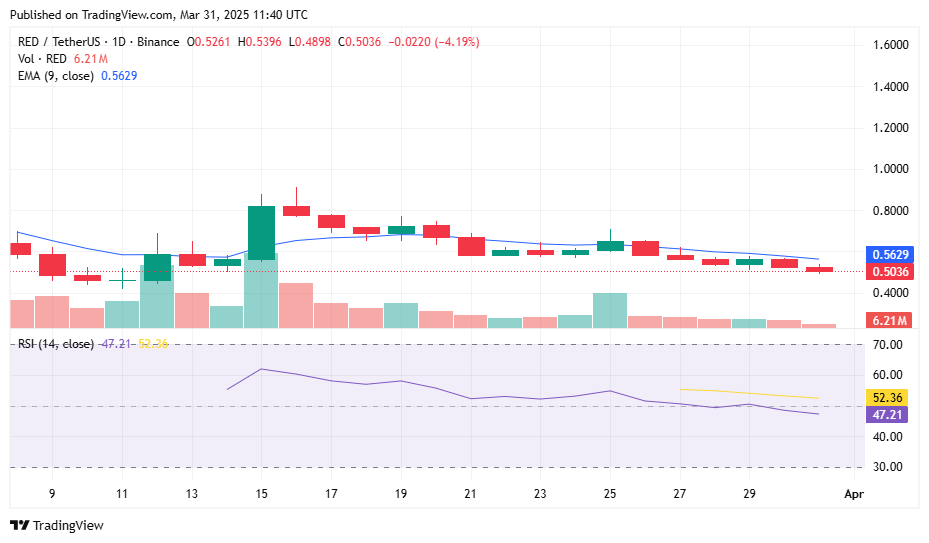
RedStone ( RED ) has dropped to $0.50, marking an 18% decline over the past week and a 43% drop from its $0.89 peak on March 16.
On March 14, the modular oracle RedStone rolled out out the DRILL program , aiming to reward early adopters and accelerate the growth of the RedStone ecosystem by allocating 4.5% of the total RED token supply to core users. The announcement triggered a surge in the token’s price, reaching $0.7545 — its highest point since March 7. This upward momentum continued, with the price climbing further to $0.89 on March 16.
However, after peaking on March 16, RED has plunged into a clear downtrend. It has been trading below the 9-day exponential moving average since March 20. Volume has also been tapering off. The price is currently hovering around $0.50, a key support level where it has been consolidating since then.
 Source: crypto.news
The Relative Strength Index sits at 47.21, indicating neutral momentum, with buying and selling pressures relatively balanced. This suggests that the market is in a wait-and-see mode, waiting for a catalyst to decide the next move.
A break above the 9-day EMA and $0.60 could signal a trend reversal, especially if RSI climbs above 50. A break below $0.50 could trigger further downside, with the next support levels at $0.45 and $0.40.
Disclaimer: The content of this article solely reflects the author's opinion and does not represent the platform in any capacity. This article is not intended to serve as a reference for making investment decisions.
You may also like
Where Meta's ambitions for the metaverse fell short
ETH Stalls & Pepe Dips, Zero Knowledge Proof’s Stage 2 Coin Burns Could be the Start of a 7000x Explosion!

Targeting $900B Remittances Could Drive The Best Crypto To Buy 2026

Crypto Enthusiasts Witness HYPE Coin’s Rebound as Key Resistance Breaks Loom