Helium (HNT) Posts Gains, But Market Signals Point to Trouble Ahead

While HNT has gained slightly, technical indicators such as the Chaikin Money Flow and MACD suggest waning demand, casting doubt on the sustainability of its rally. The token faces a critical test at the $3.84 support level.
Helium’s native token, HNT, has bucked the broader market trend to register a modest 2% gain over the past 24 hours. At press time, the altcoin is exchanging hands at $3.94.
However, despite the positive price action, technical indicators suggest that the rally may be short-lived. Market momentum around HNT is waning, casting doubt on the sustainability of the current uptick.
HNT Tops Gains, But Bearish Signals Loom
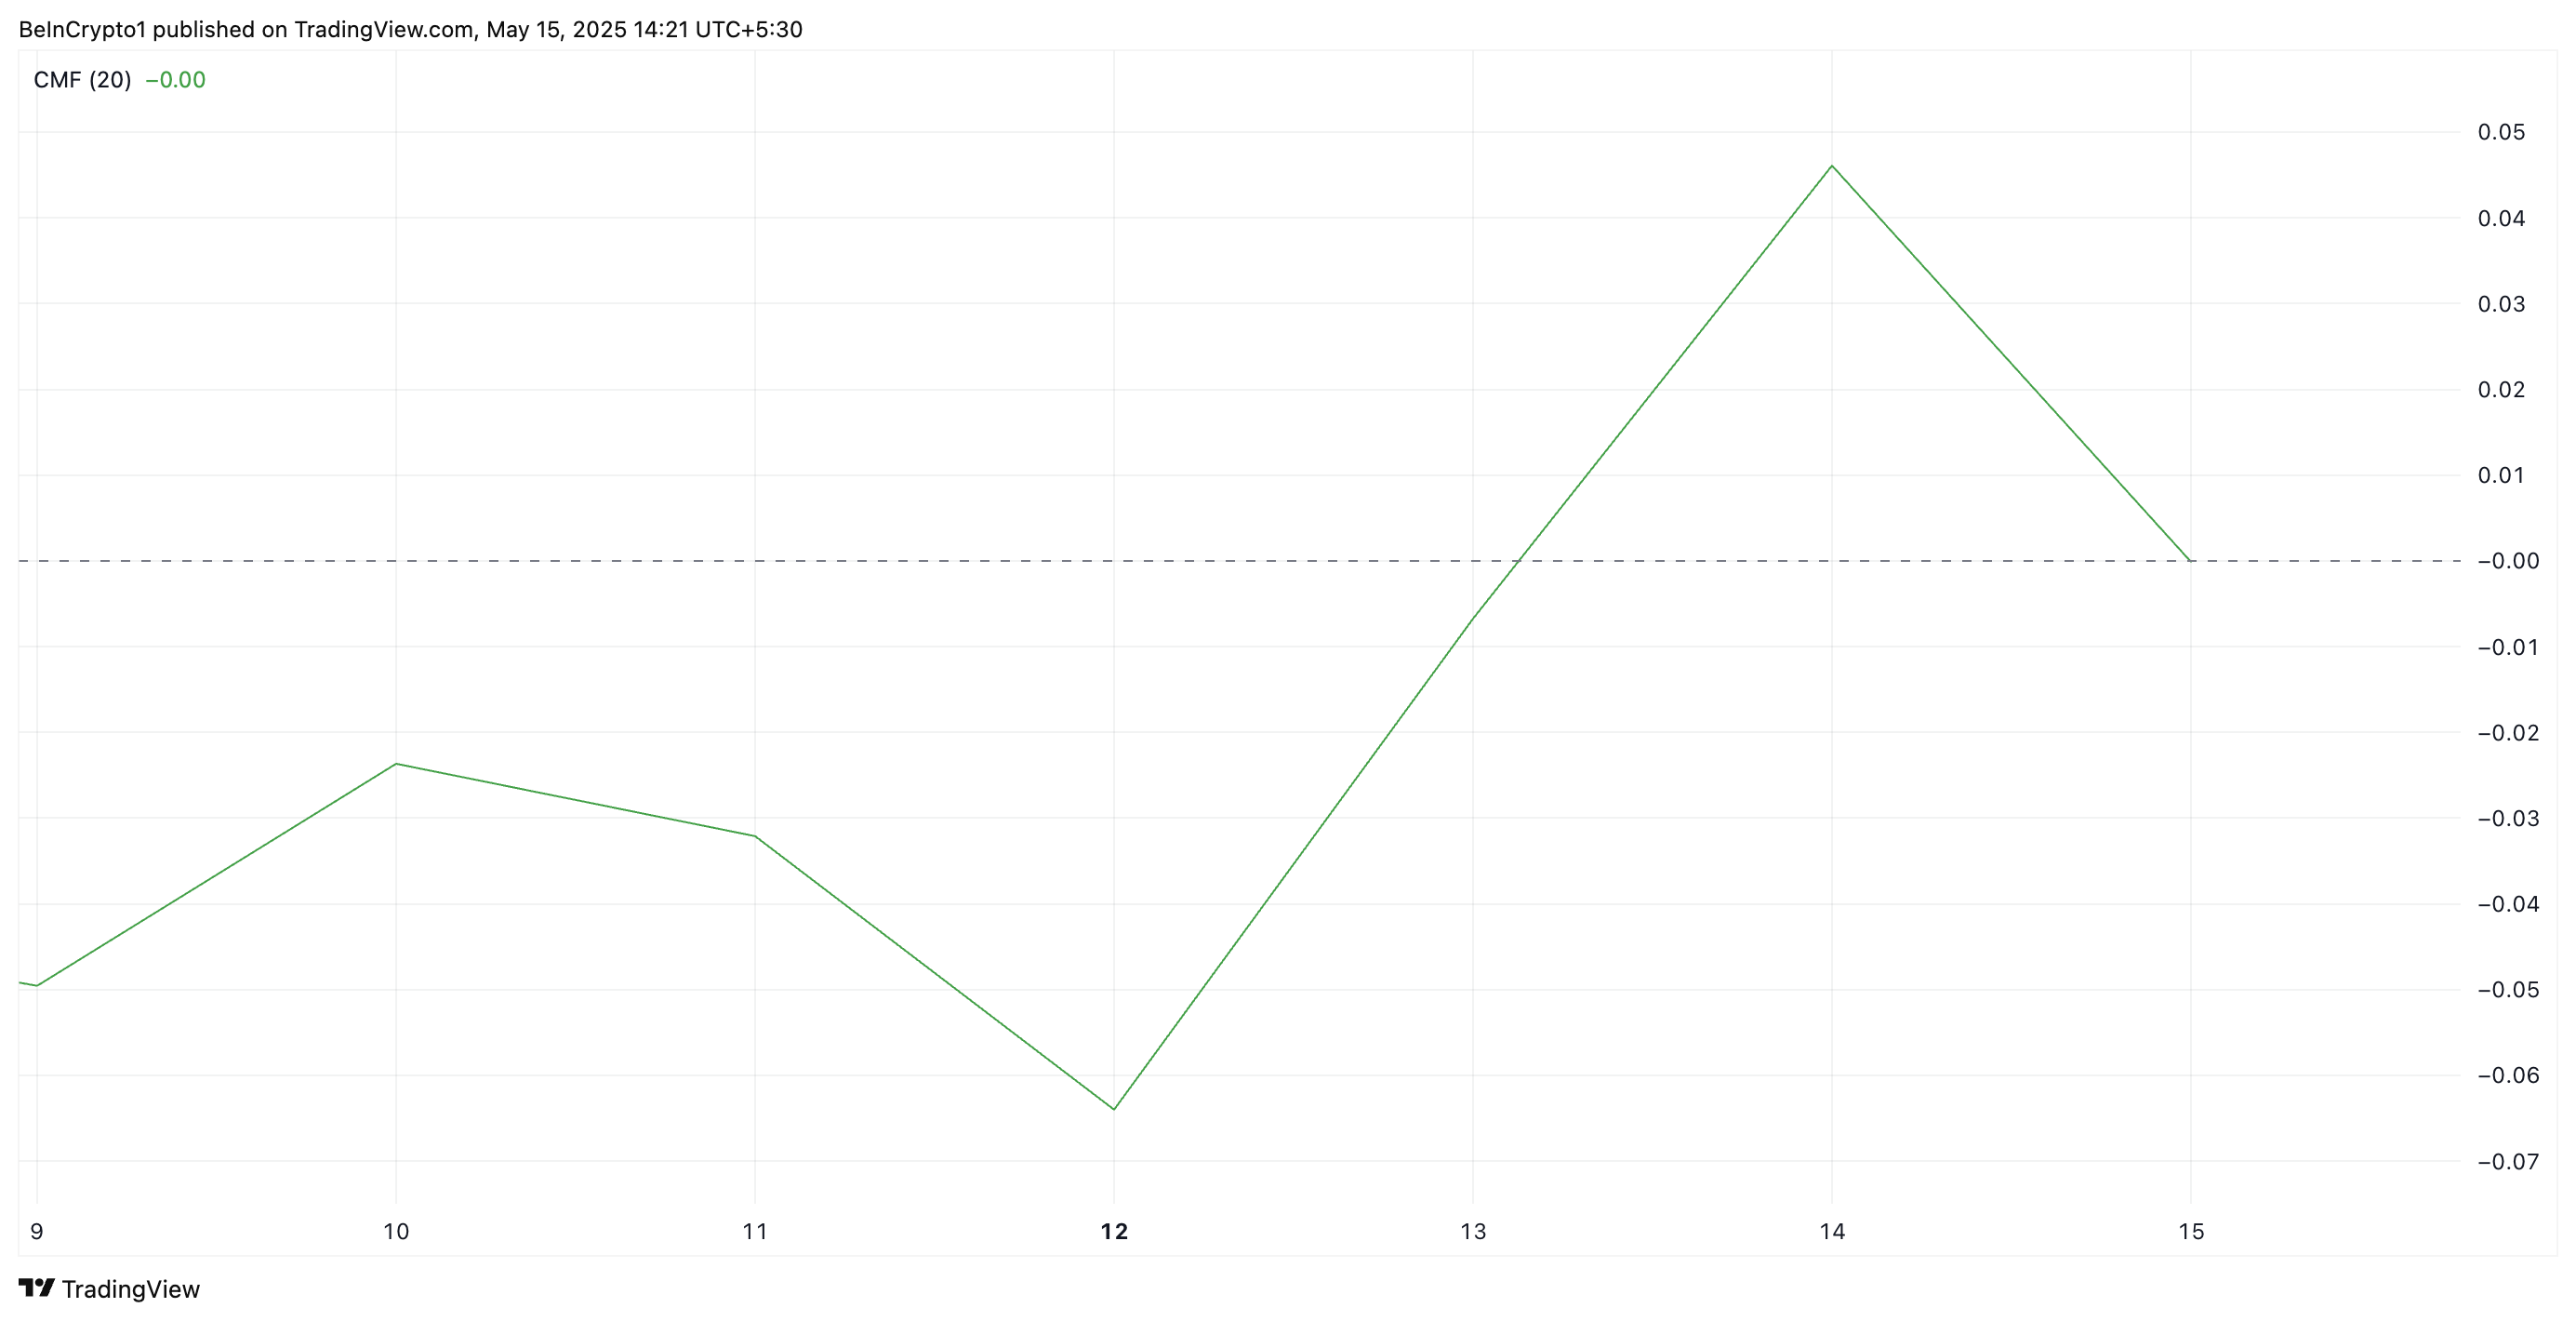
On the HNT/USD one-day chart, the token’s Chaikin Money Flow (CMF) trends downward, even as the price climbs higher. As of this writing, HNT’s CMF sits on the zero line, poised to break below it.
 HNT CMF. Source:
TradingView
HNT CMF. Source:
TradingView
The CMF indicator measures how money flows into and out of an asset. When the price rises while the CMF falls, a bearish divergence emerges. This divergence typically signals weakening buying pressure and a potential reversal ahead.
For HNT, this means that while buyers have managed to push the price up, the declining CMF reveals that underlying demand may not be strong enough to sustain the rally.
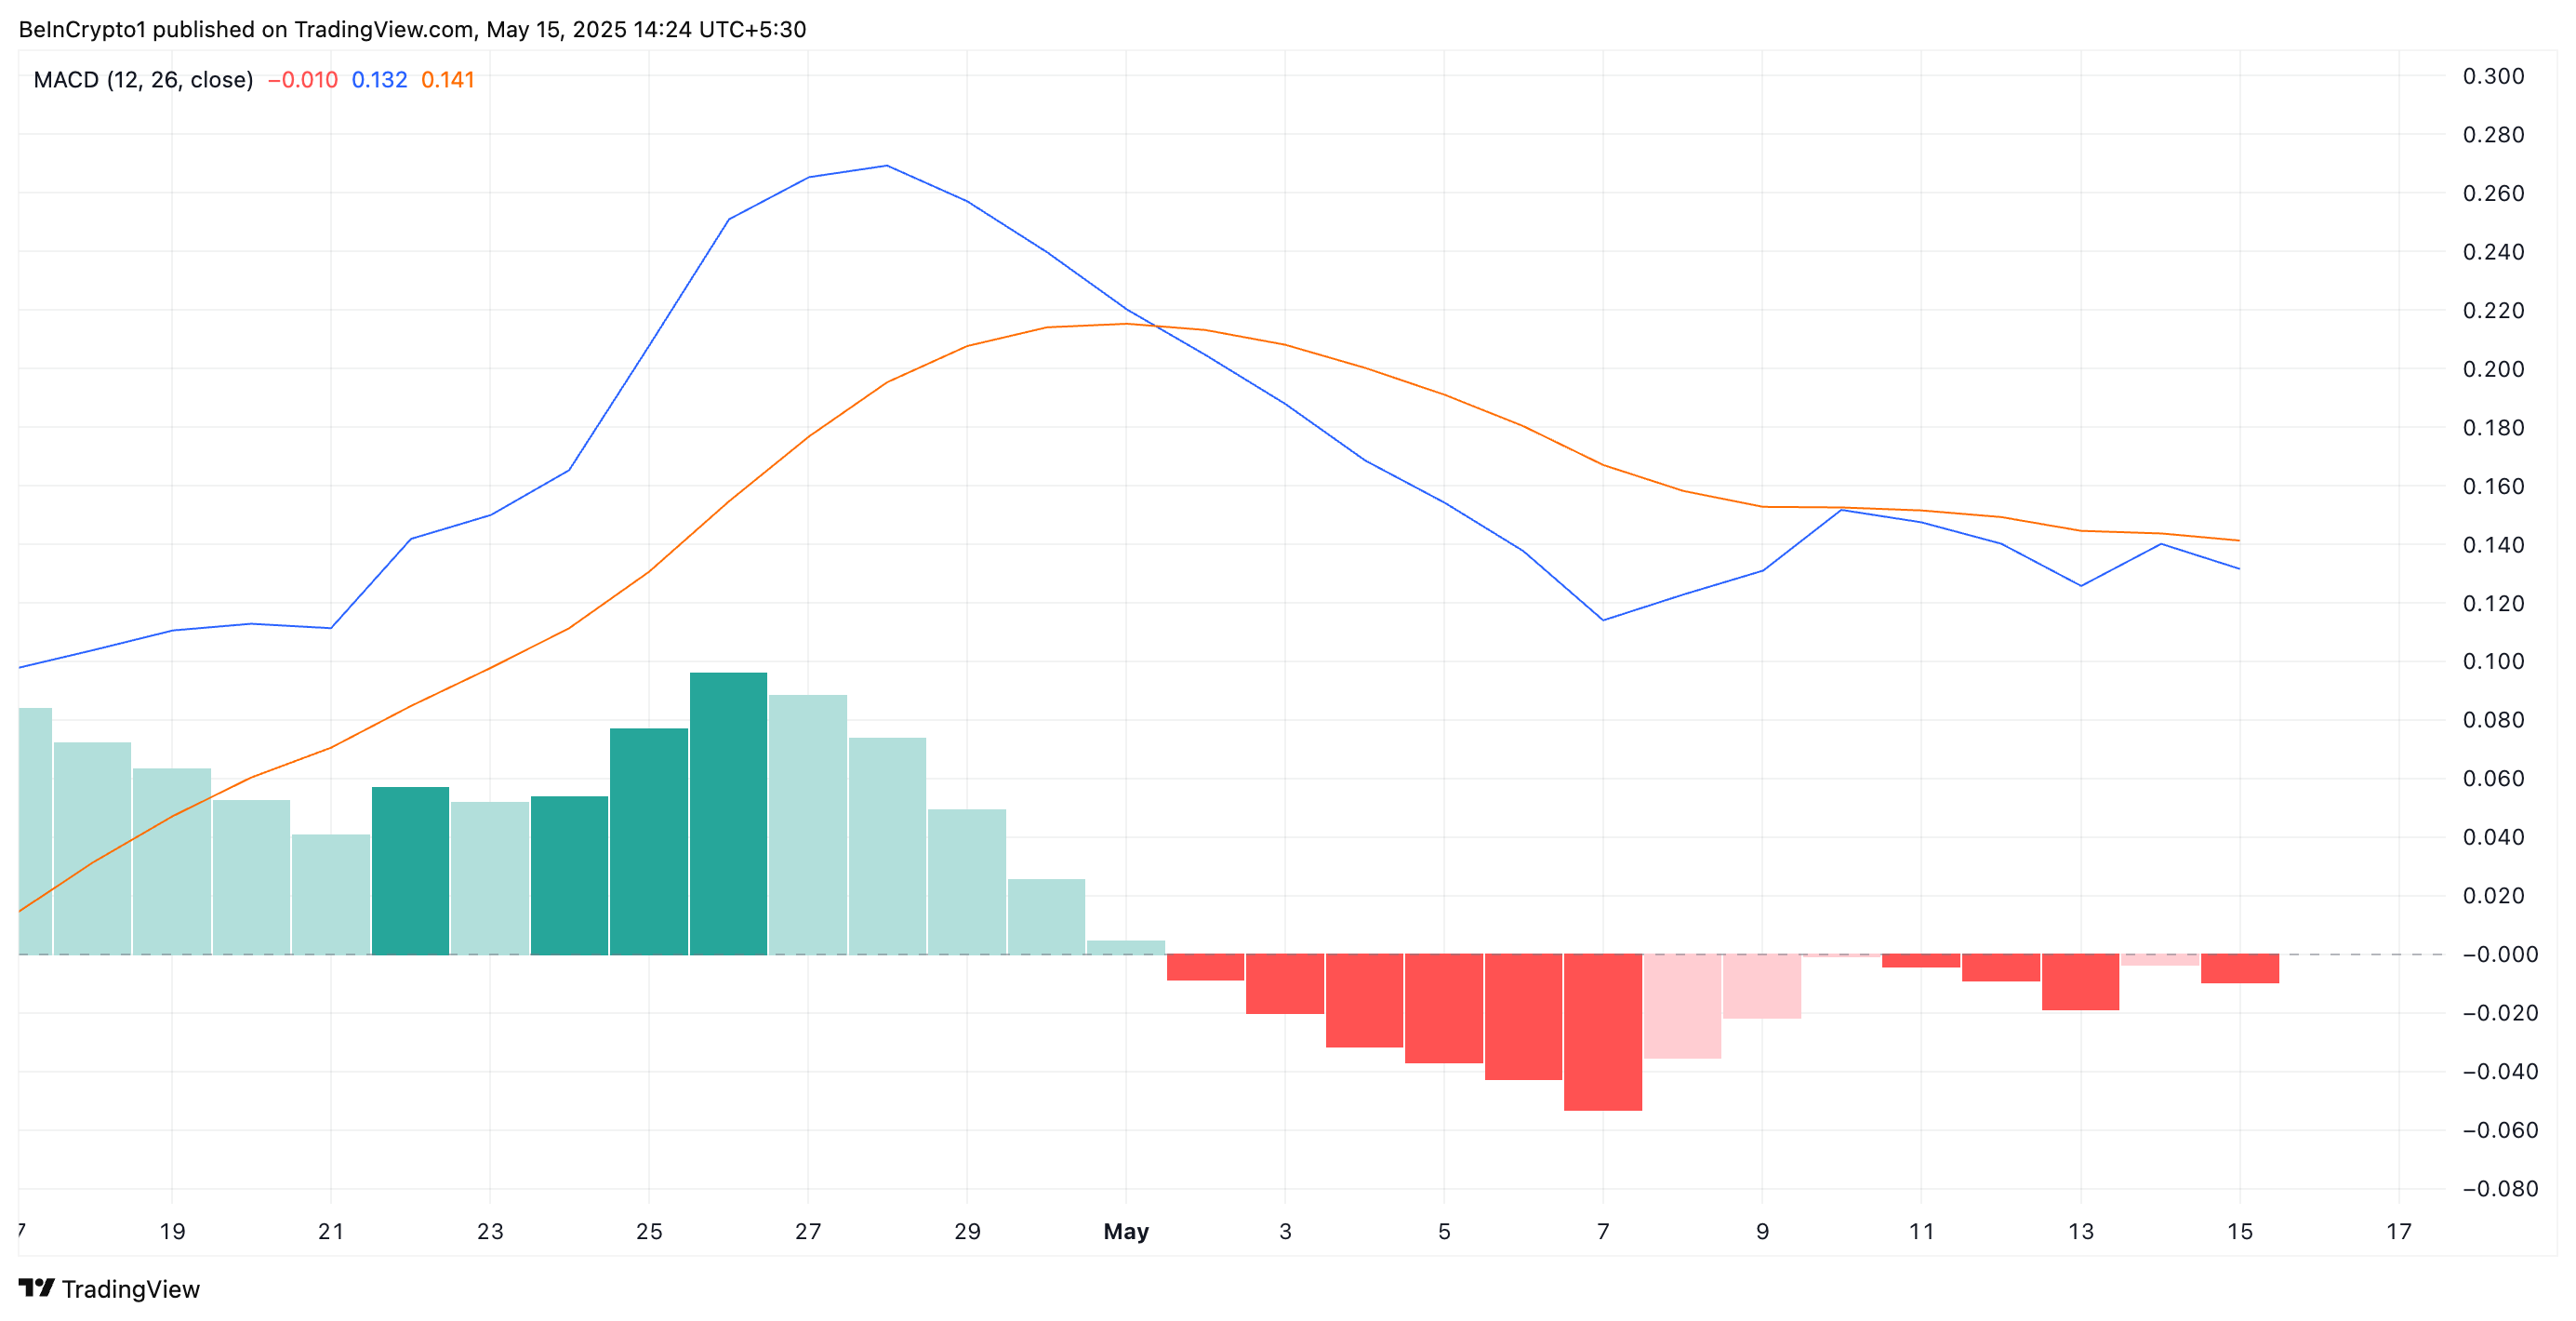
Furthermore, the setup of HNT’s Moving Average Convergence Divergence (MACD) indicator supports this bearish outlook. Currently, the token’s MACD line (blue) rests below its signal line (orange), indicating a negative bias toward it.
 HNT MACD. Source:
TradingView
HNT MACD. Source:
TradingView
An asset’s MACD indicator identifies trends and momentum in its price movement. It helps traders spot potential buy or sell signals through crossovers between the MACD and signal lines.
When the MACD line is under the signal line, it indicates bearish momentum. This means token distribution exceeds accumulation among traders, a trend that exacerbates an asset’s price drop.
HNT’s Rally Faces Key Test as Buyers Lose Steam
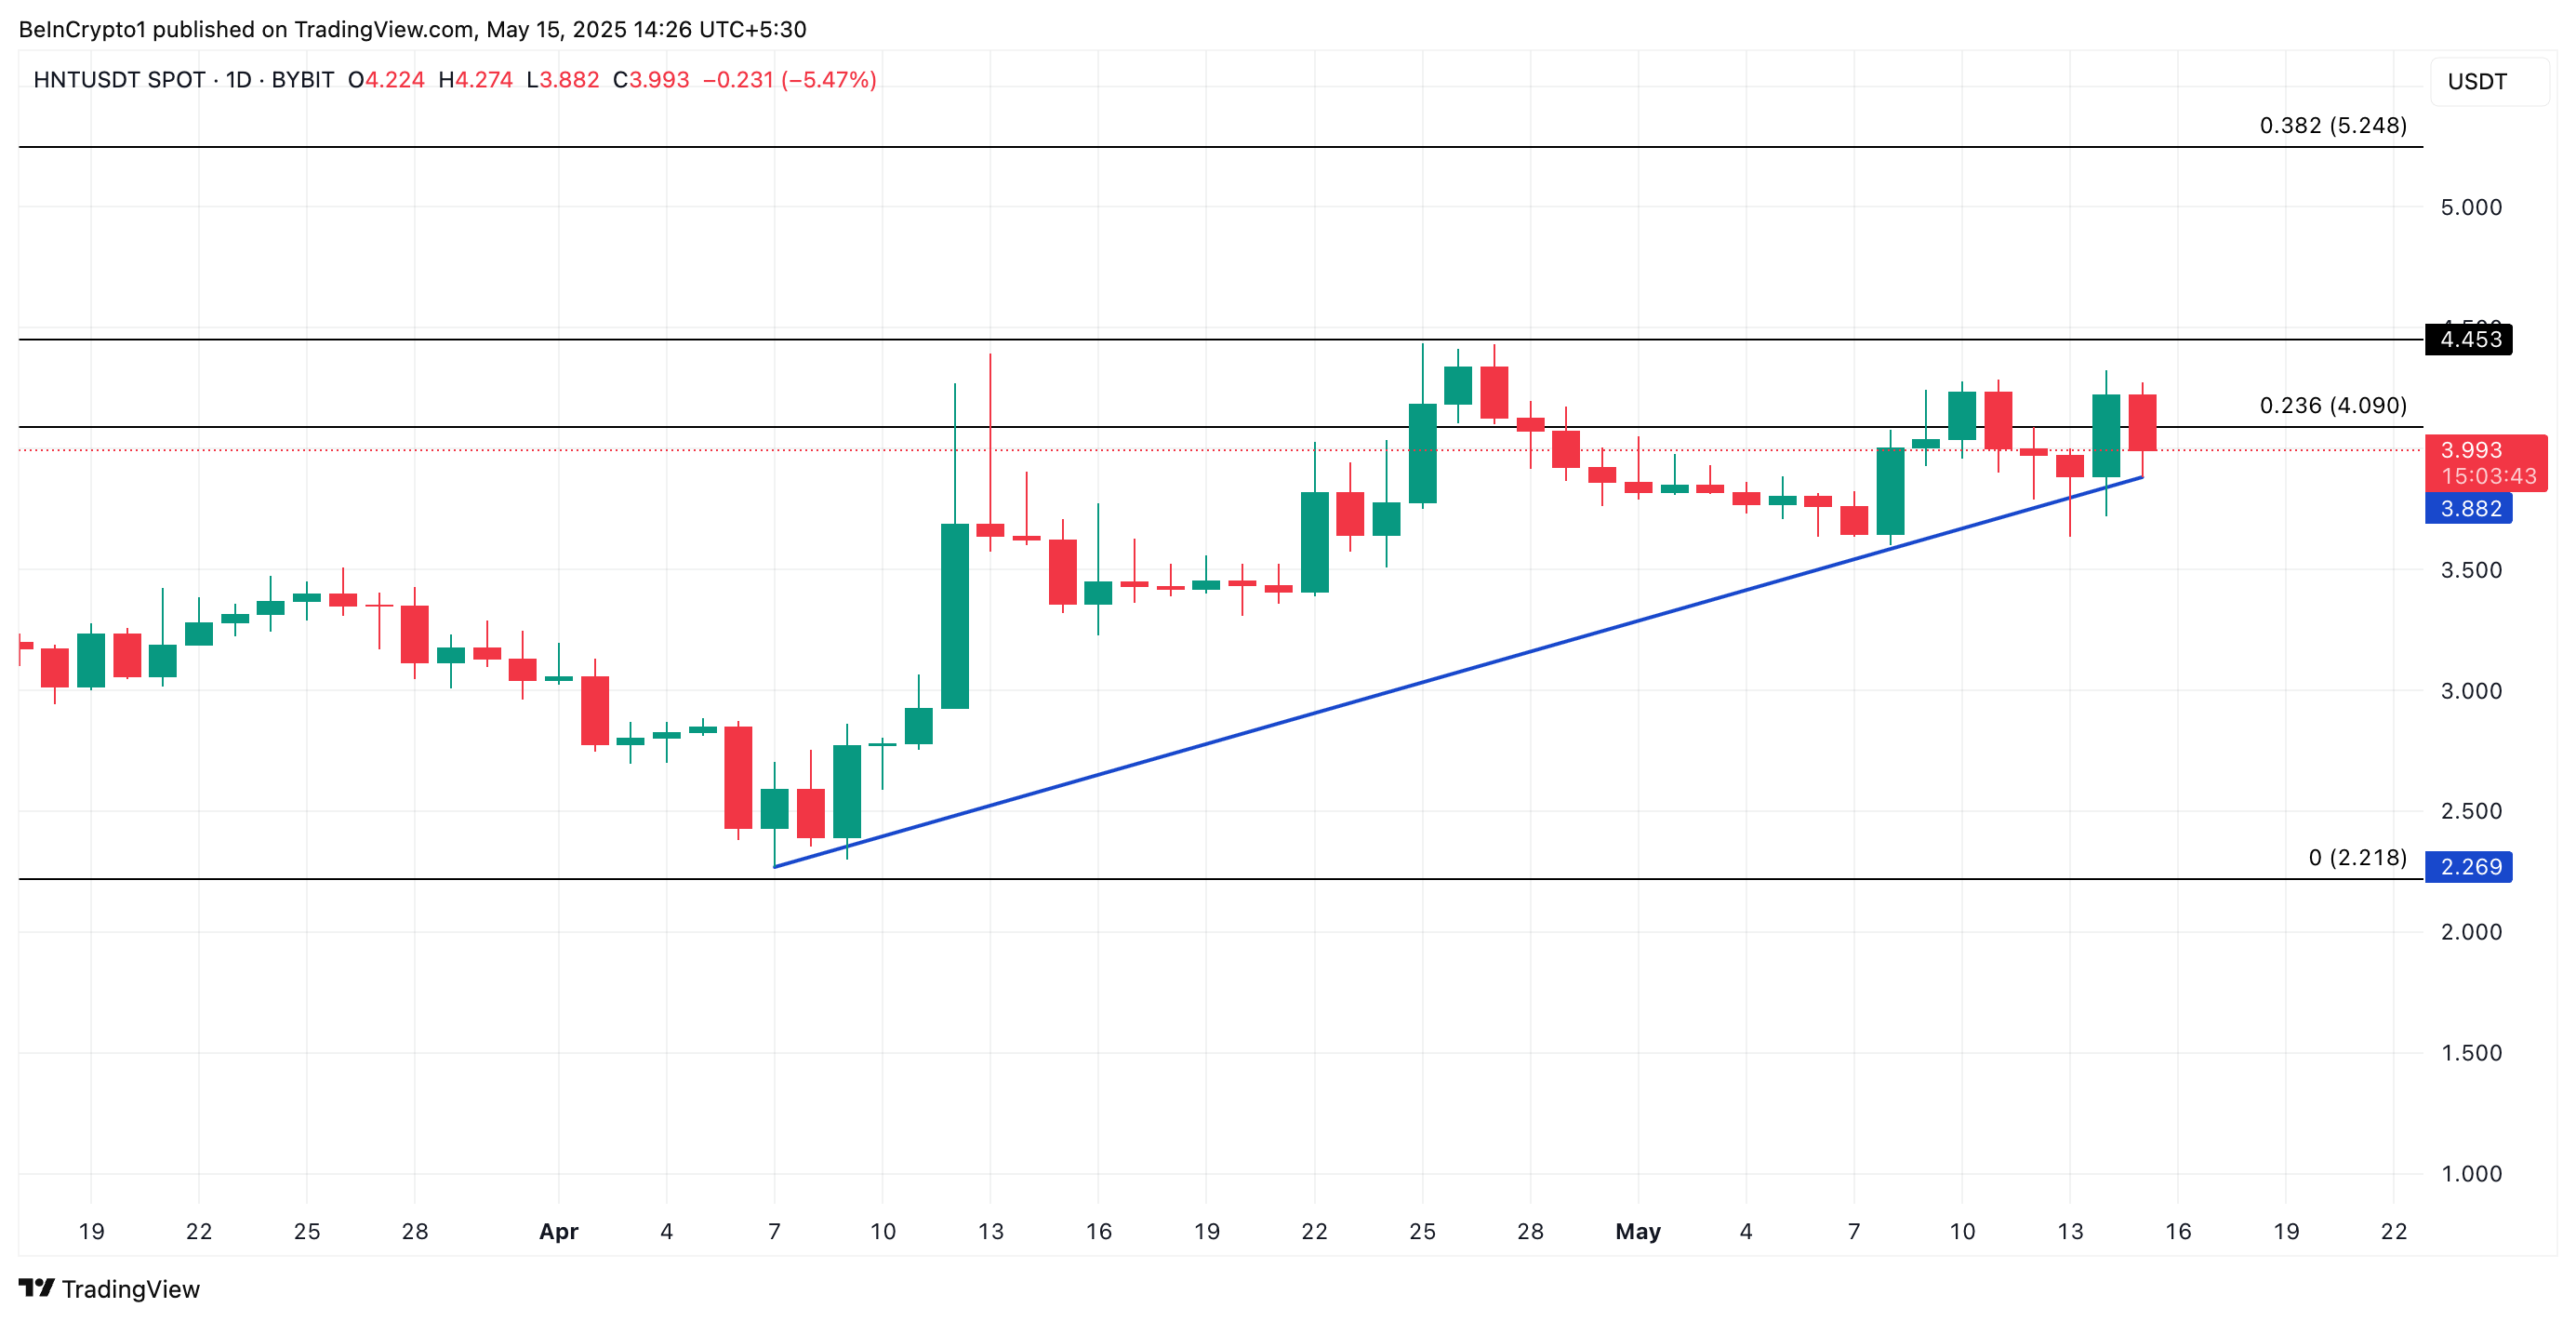
Since April 7, HNT has been trading above an ascending trend line, reflecting a steady price rally. When this pattern holds, it signals a surge in the asset’s value driven by strong demand. However, with waning buying pressure, HNT faces the risk of breaking below this trend line, which currently acts as critical support at $3.88.
A break below this key support could push HNT down toward $2.21
 HNT Price Analysis. Source:
TradingView
HNT Price Analysis. Source:
TradingView
Conversely, if buying picks up, HNT could sustain its upward momentum and break above the $4 mark.
Disclaimer: The content of this article solely reflects the author's opinion and does not represent the platform in any capacity. This article is not intended to serve as a reference for making investment decisions.
You may also like
Solana DEX Jupiter Unveils JupUSD, Returning Native Treasury Yield to Users
ChatGPT suddenly announces ads, $8 subscription plan can't avoid them

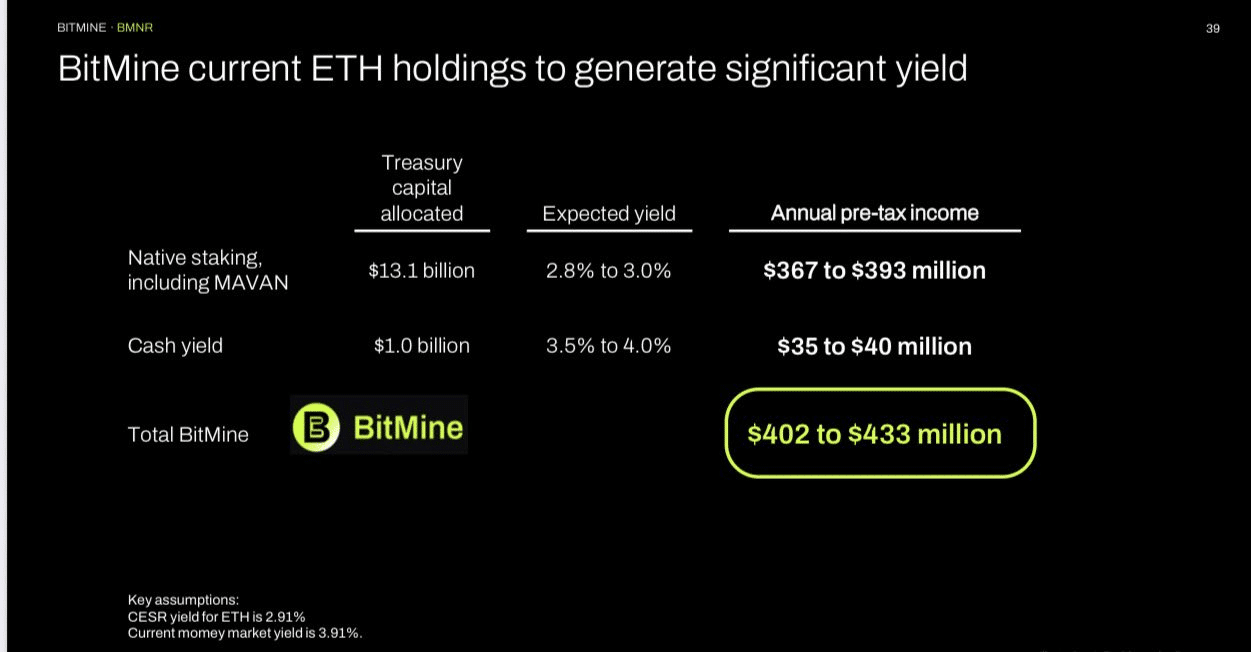
From $3.5K to $12K? Here’s why BMNR’s Ethereum forecast makes sense