Bitget App
Trade smarter
Buy cryptoMarketsTradeFuturesEarnSquareMore
The Graph (GRT) To Bounce Back From the Current Dip? This Fractal Setup Saying Yes!

The Graph (GRT) To Bounce Back From the Current Dip? This Fractal Setup Saying Yes!

CoinsProbeCoinsProbe2025/07/31 23:35
By:Nilesh Hembade

Date: Wed, July 30, 2025 | 09:40 AM GMT

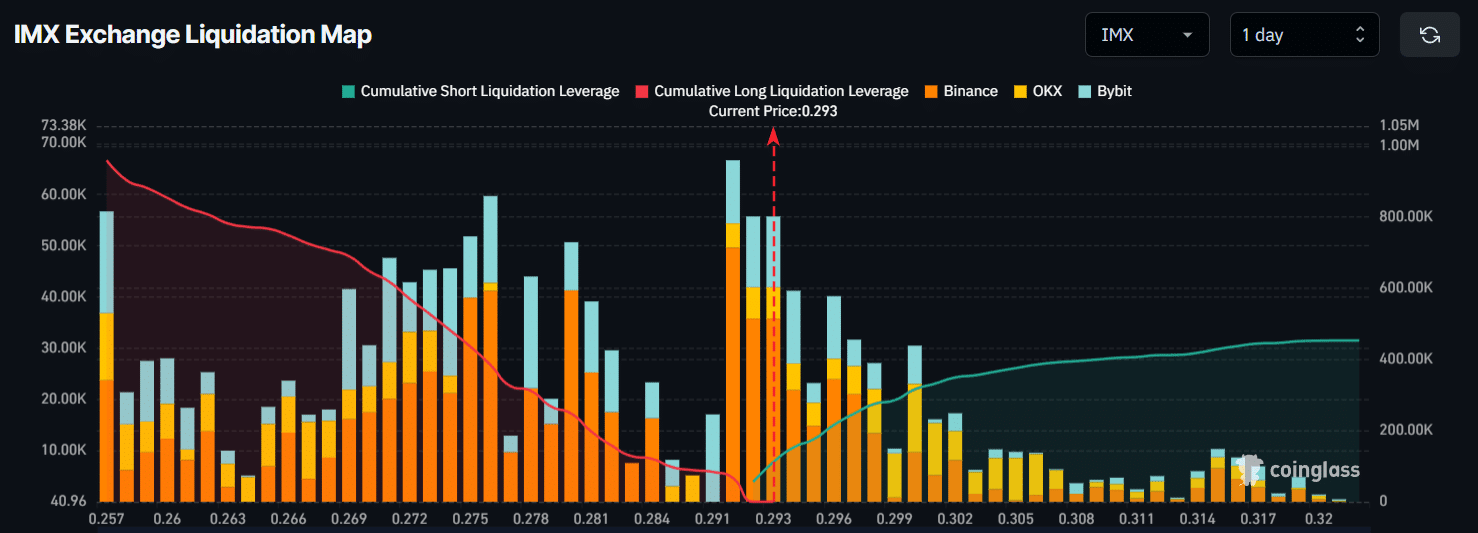
The broader cryptocurrency market is undergoing a pullback after Ethereum (ETH) tested its multi-year resistance around $3,940 before easing to $3,775. This pullback has weighed on major  altcoins ,, with The Graph (GRT) sliding 5% today and trimming its monthly gains to 17%.

However, a deeper look into GRT’s daily chart suggests this may just be a healthy retest within a larger bullish setup. A familiar fractal pattern — which led to a major breakout in 2024 — is beginning to resurface.

The Graph (GRT) To Bounce Back From the Current Dip? This Fractal Setup Saying Yes! image 0 
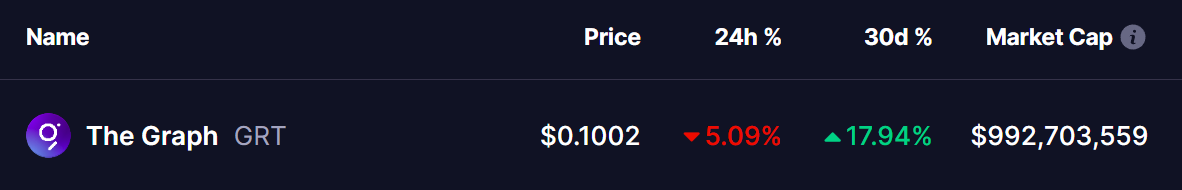
Source: Coinmarketcap

Fractal Setup Hints at a Bullish Reversal

Back in late 2024, GRT broke out of its descending channel, reclaimed the 100-day moving average, and shortly after, cleared the 200-day MA. It then underwent a short consolidation phase — a typical retest — before exploding 76% to the upside.

The Graph (GRT) To Bounce Back From the Current Dip? This Fractal Setup Saying Yes! image 1 
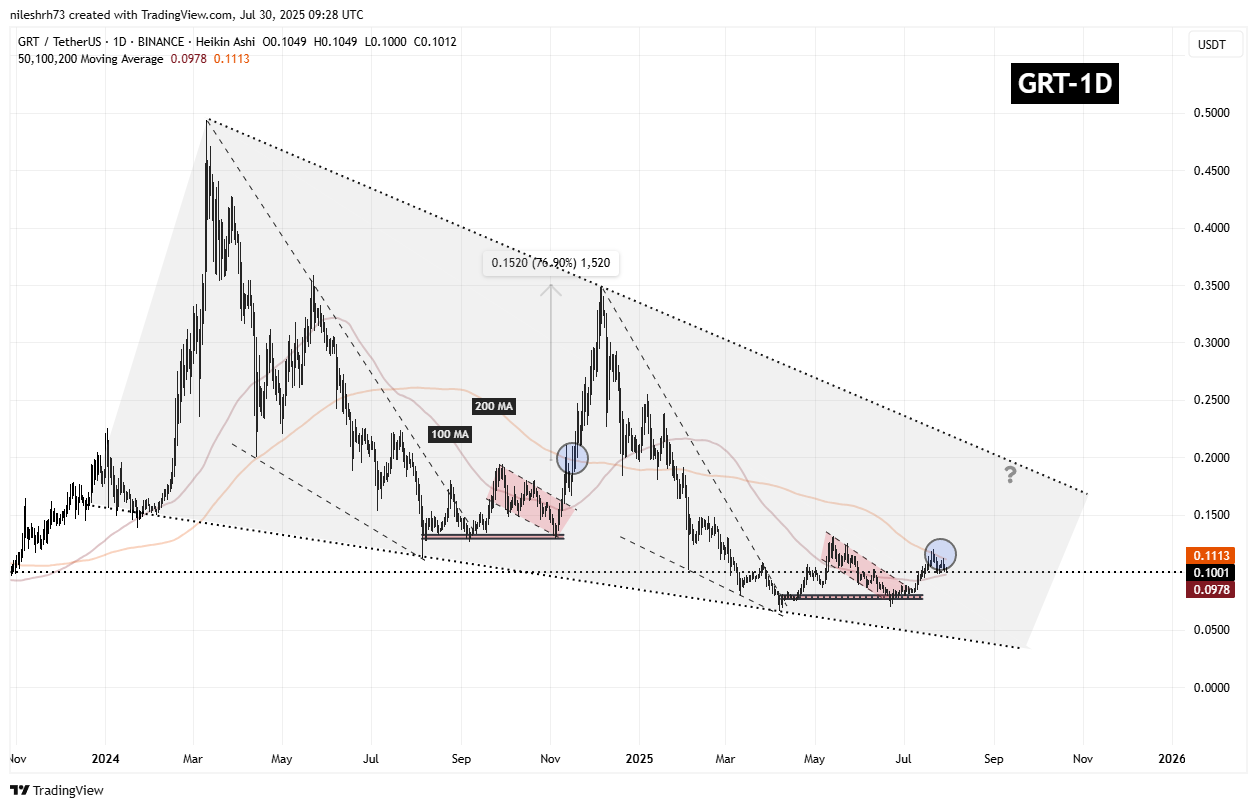
The Graph (GRT) Daily Chart/Coinsprobe (Source: Tradingview)

Fast forward to now, and the pattern appears to be repeating.

GRT has once again broken out of a descending channel and reclaimed its 100-day moving average. Its current price action is hovering around the 200-day MA at $0.1113, consolidating in a tight range — marked by the same type of correction that preceded its prior breakout. The resemblance to the 2024 structure is striking and may be more than coincidence.

What’s Next for GRT?

If GRT can hold its ground above the 100-day MA at $0.0978 and manage a clean break above the 200-day MA, this current consolidation could mark the beginning of another leg higher. Should the fractal fully play out, GRT could climb toward the upper resistance of the broader falling wedge pattern — near the $0.19–$0.20 range — offering a potential 90% upside from current levels.

0

Disclaimer: The content of this article solely reflects the author's opinion and does not represent the platform in any capacity. This article is not intended to serve as a reference for making investment decisions.

PoolX: Earn new token airdrops
Lock your assets and earn 10%+ APR
Lock now!

You may also like

The hidden narrative behind ZEC's surge: The migration of a safe haven for "Chen Zhi and Qian Zhimin"

Bitcoin serves as insurance against fiat currency; Zcash (ZEC) is insurance against Bitcoin.

Chaincatcher2025/11/21 10:51
The hidden narrative behind ZEC's surge: The migration of a safe haven for "Chen Zhi and Qian Zhimin"

Eight Years of Solana: Anatoly Shares the Behind-the-Scenes Story

With such an outstanding founder and product, why hasn’t the token price increased?

Chaincatcher2025/11/21 10:51
Eight Years of Solana: Anatoly Shares the Behind-the-Scenes Story

Info Finance Prototype: How Can Prediction Markets Evolve from "Betting on the Future" to "Influencing the Future"?

When "using money to influence outcomes" becomes profitable, prediction markets gain the power to change facts.

Chaincatcher2025/11/21 10:48
Info Finance Prototype: How Can Prediction Markets Evolve from "Betting on the Future" to "Influencing the Future"?

Global crash: What exactly happened?

Global plunge, everyone is comparing losses.

Chaincatcher2025/11/21 10:47
Global crash: What exactly happened?