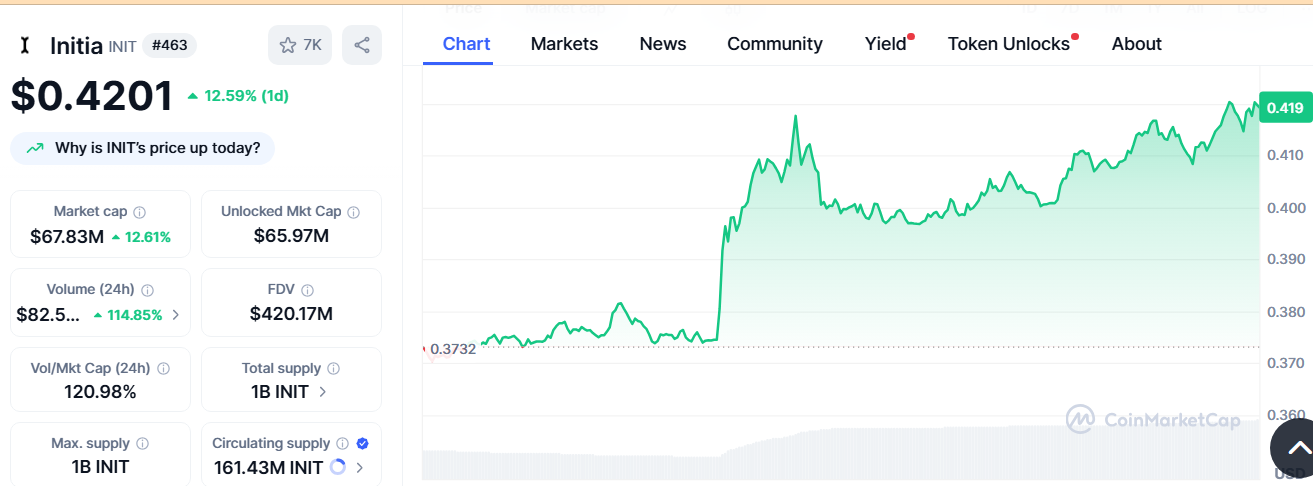
- INIT trades at $0.4210 with a 12.99% daily gain, approaching the $0.436 resistance level.
- The falling wedge pattern signals tightening price action and increased trading activity, backed by a 110.66% volume surge.
- Market cap rose to $67.96 million, while circulating supply remains at 161.43 million INIT.
INIT has gained 12.99% in the past 24 hours, rising to $0.4210, according to data from CoinMarketCap. This movement comes as the token trades within a falling wedge pattern on the 12-hour chart. Traders are closely monitoring this structure because it often indicates a potential shift in market direction if a breakout occurs. Notably, volume has surged by 110.66% to $82.1 million, reinforcing the market’s heightened activity.
The current price is testing the $0.436 level, which remains a critical area for near-term price action. A decisive breakout above this point may bring $0.4825 into focus as the next resistance. The falling wedge pattern has developed over several weeks , with INIT consolidating between lower highs and lower lows.
This structure has narrowed recently, placing emphasis on the upper trendline. In addition, INIT has held support levels near $0.3840, which continues to act as a base for short-term price stability.
Market Metrics Highlight Strong Trading Activity in INIT
Alongside its price action, INIT’s market cap has increased by 12.85% to $67.96 million. The circulating supply currently stands at 161.43 million tokens out of a total supply of 1 billion.
 Source: CoinMarketCap
Furthermore, the token’s fully diluted valuation (FDV) has reached $420.46 million. These metrics, combined with the trading volume spike, highlight a period of notable activity. The relationship between volume and market cap now sits at 120.98%, signaling intensified trading participation.
Resistance Test and Volume Trends Shape INIT’s Next Move
Despite the recent gains, market focus remains on how INIT interacts with its resistance levels. The 12-hour chart indicates that a breakout from the wedge could potentially extend toward $0.8230, its recent high. However, this level depends on sustained momentum and whether price movement holds above short-term support.
As trading sessions unfold, INIT’s position relative to the wedge’s trendlines will remain crucial for market participants analyzing its next steps. INIT’s price action remains centered on the falling wedge structure. Traders will closely track resistance levels and volume trends to determine whether the token sustains momentum or consolidates near current levels.

