

Date: Tue, Oct 07, 2025 | 04:59 AM GMT
As per its historical October performance, the cryptocurrency market is showing strong upside momentum. Over the past seven days, Bitcoin (BTC) and Ethereum (ETH) have surged by over 9% and 12%, respectively — a move that has lifted overall market sentiment. Riding this positive wave, major altcoins are flashing early bullish signals — and Akash Network (AKT) appears to be one of the most promising setups on the chart.
AKT has posted modest weekly gains, but its technical structure suggests that a larger bullish move could be in the making soon.
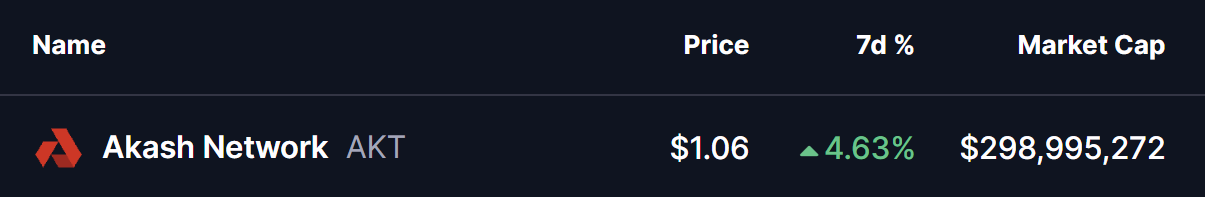 Source: Coinmarketcap
Falling Wedge Pattern in Play
On the daily chart, AKT is forming a falling wedge — a classic bullish pattern that typically signals weakening selling pressure and the potential for an upside breakout.
Recently, AKT’s correction brought the price down to the wedge’s lower boundary near $0.95, a key support zone that has once again held firm. Following this test, AKT rebounded strongly, recovering to around $1.06, and is now hovering just below the wedge’s upper resistance trendline.
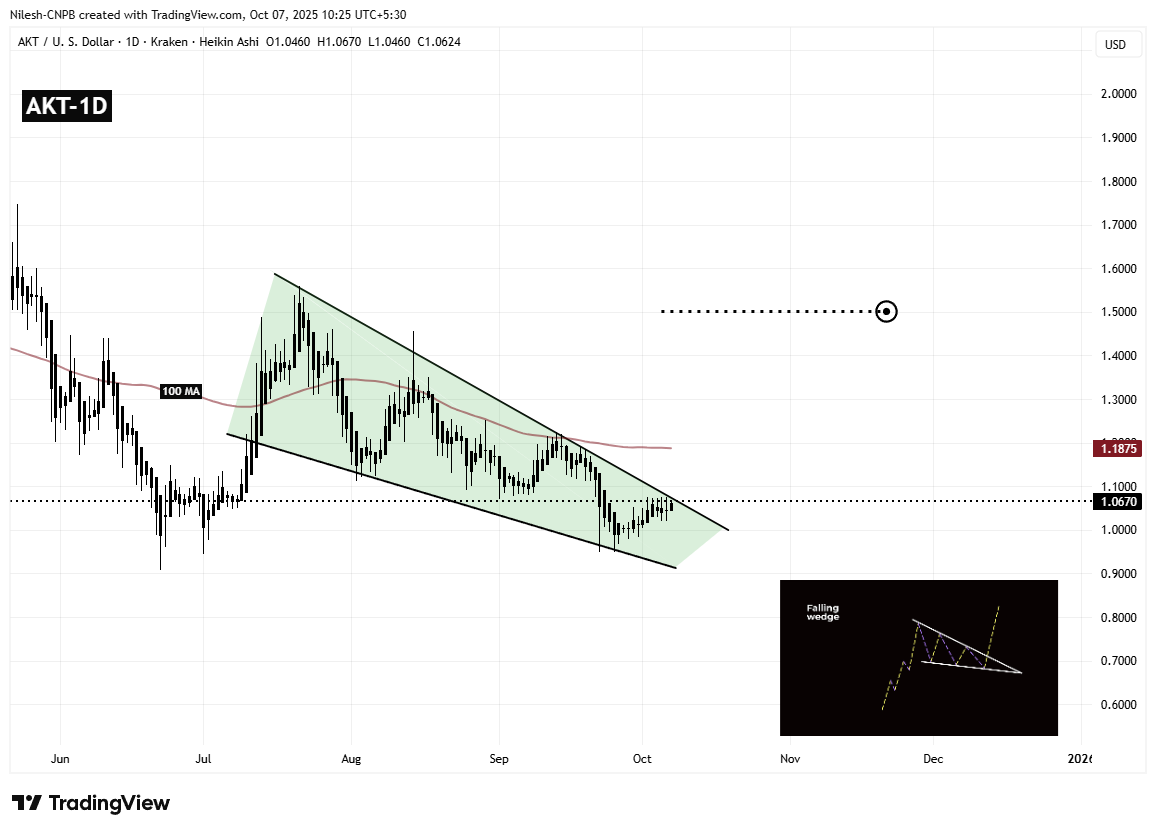 Akash Network (AKT) Daily Chart/Coinsprobe (Source: Tradingview)
Adding to this, the 100-day moving average (MA), positioned near $1.18, serves as a crucial confirmation level — bulls will need to reclaim this mark to validate a breakout and shift short-term momentum firmly in their favor.
What’s Next for AKT?
If buyers manage to break above the wedge resistance and sustain a close above the 100-day MA ($1.18), it could ignite a strong bullish continuation. In that scenario, AKT may rally toward its projected target near $1.50, representing an upside potential of over 40% from current levels. Such a breakout would not only mark the end of the multi-month consolidation phase but could also attract momentum traders looking to capitalize on the reversal, potentially fueling further gains.
However, if the breakout attempt fails, AKT could retest the support zone, where bulls must step in to defend the pattern structure and keep the bullish outlook intact.
For now, all eyes are on whether AKT can build enough momentum to break out of its wedge and kickstart a new leg higher in the days ahead.