
Bitcoin (BTC) Price Analysis for October 12

The market is neutral on the last day of the week, according to CoinStats.
BTC/USD
The rate of Bitcoin (BTC) has fallen by 0.44% since yesterday.
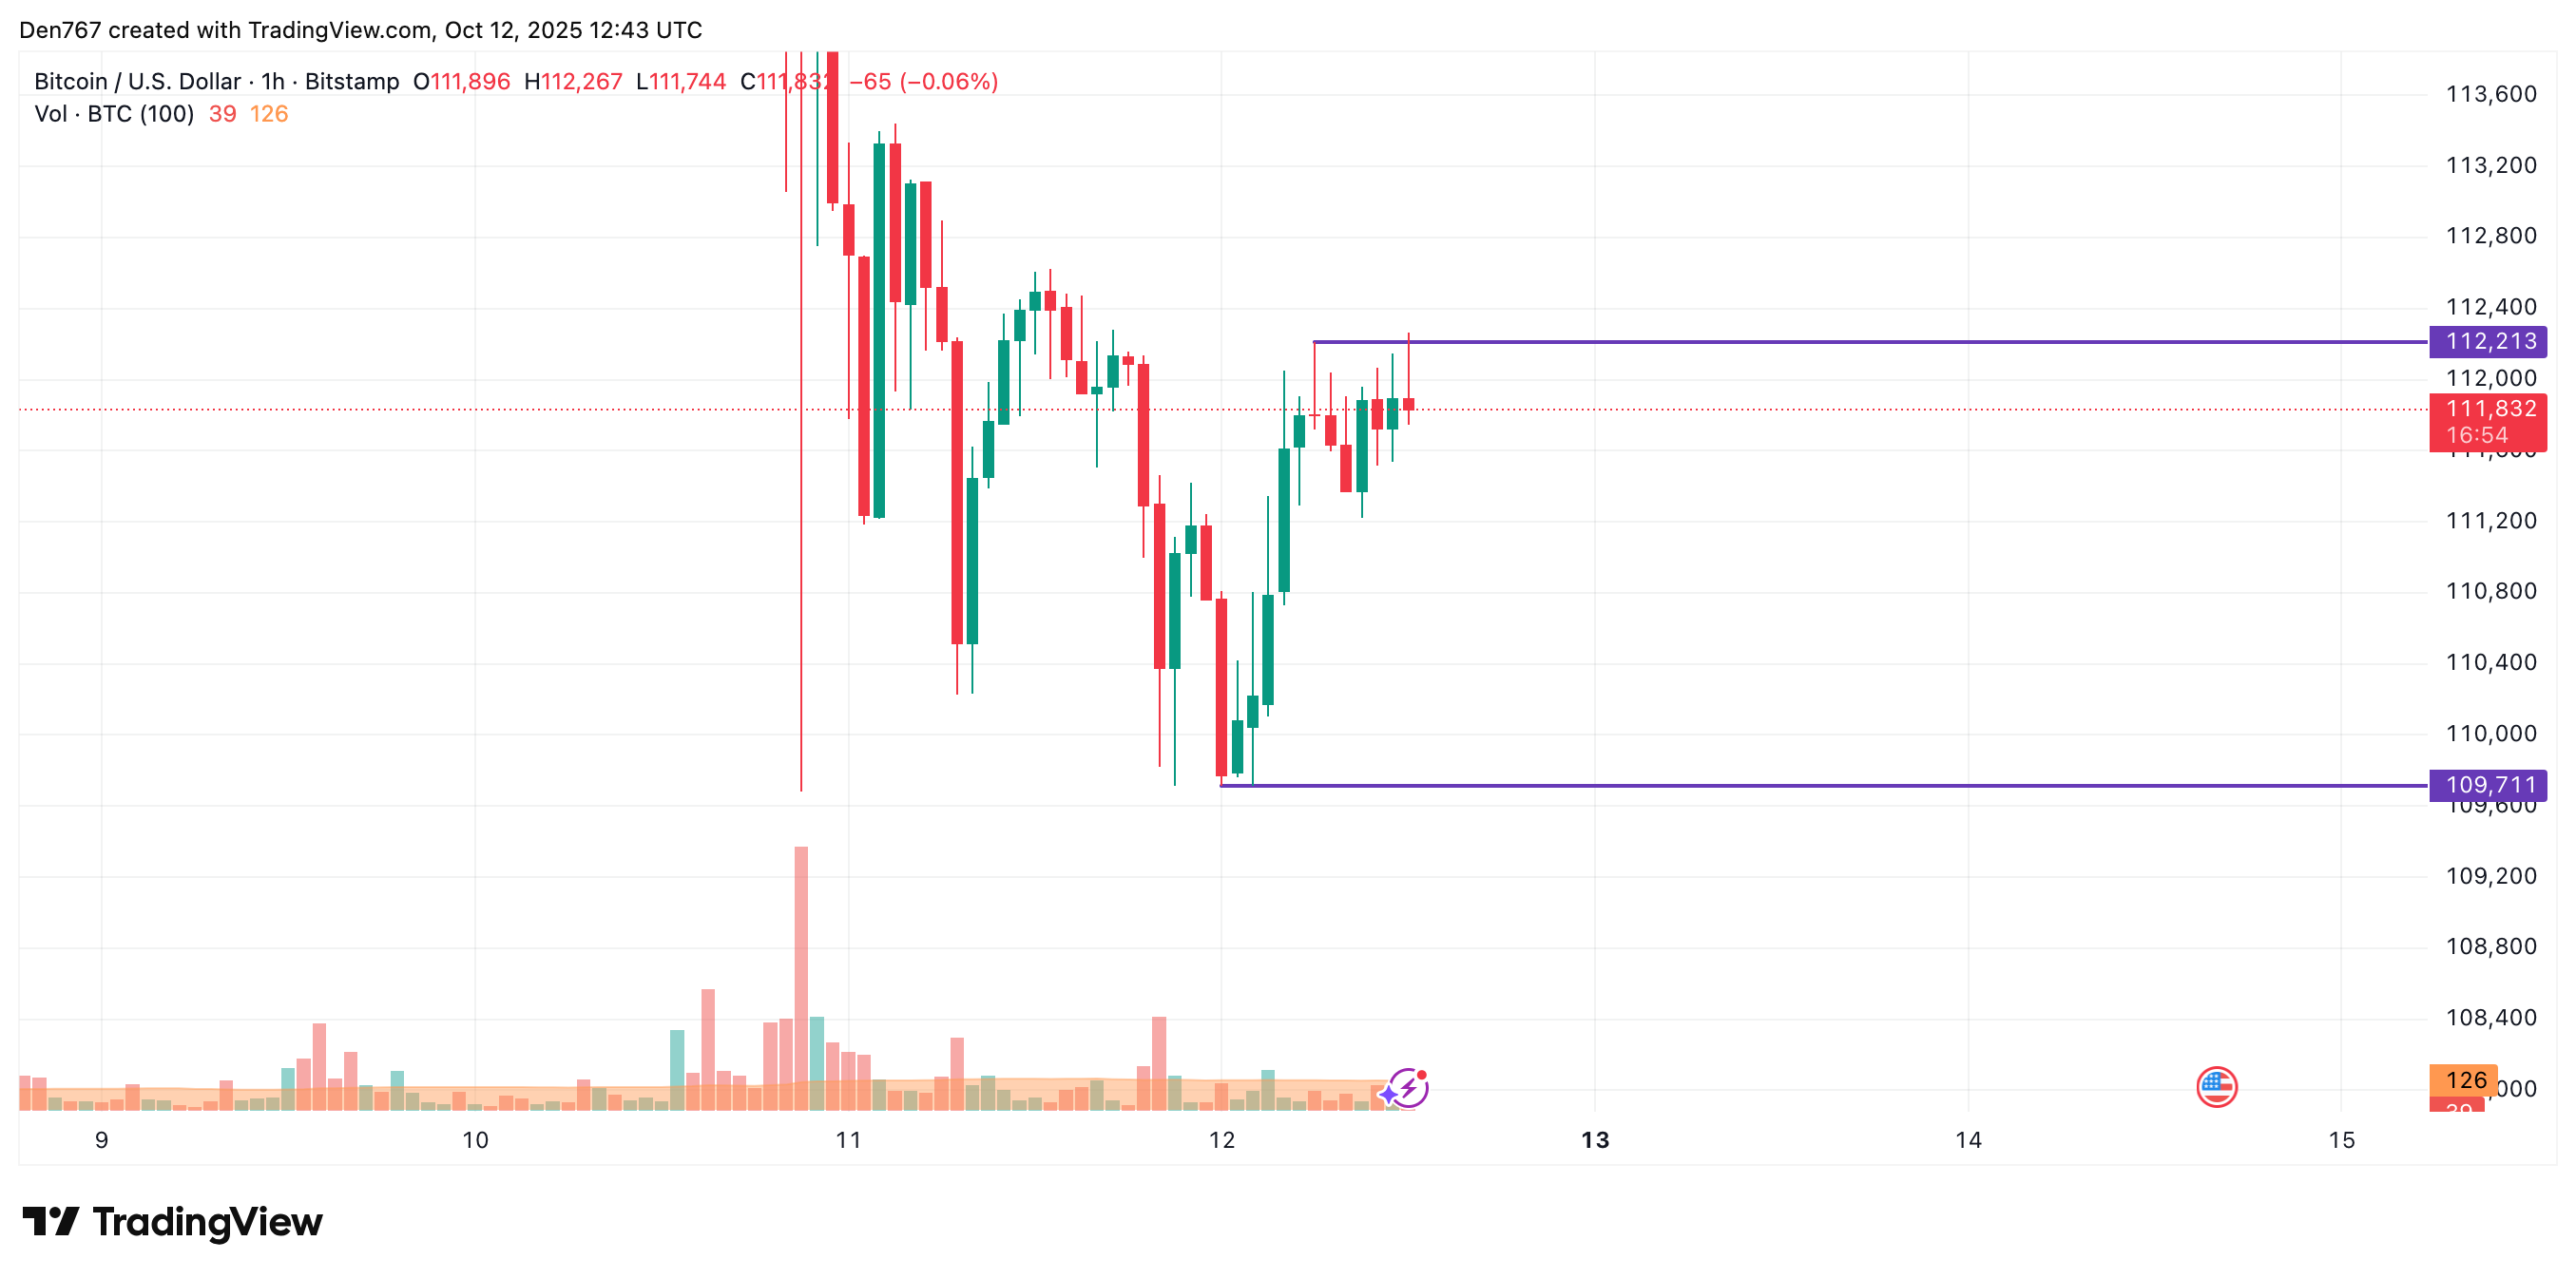
Despite today's fall, the price of BTC is looking bullish on the hourly chart. If a breakout of the local resistance of $112,213 happens, the growth is likely to continue to the $113,000 mark.
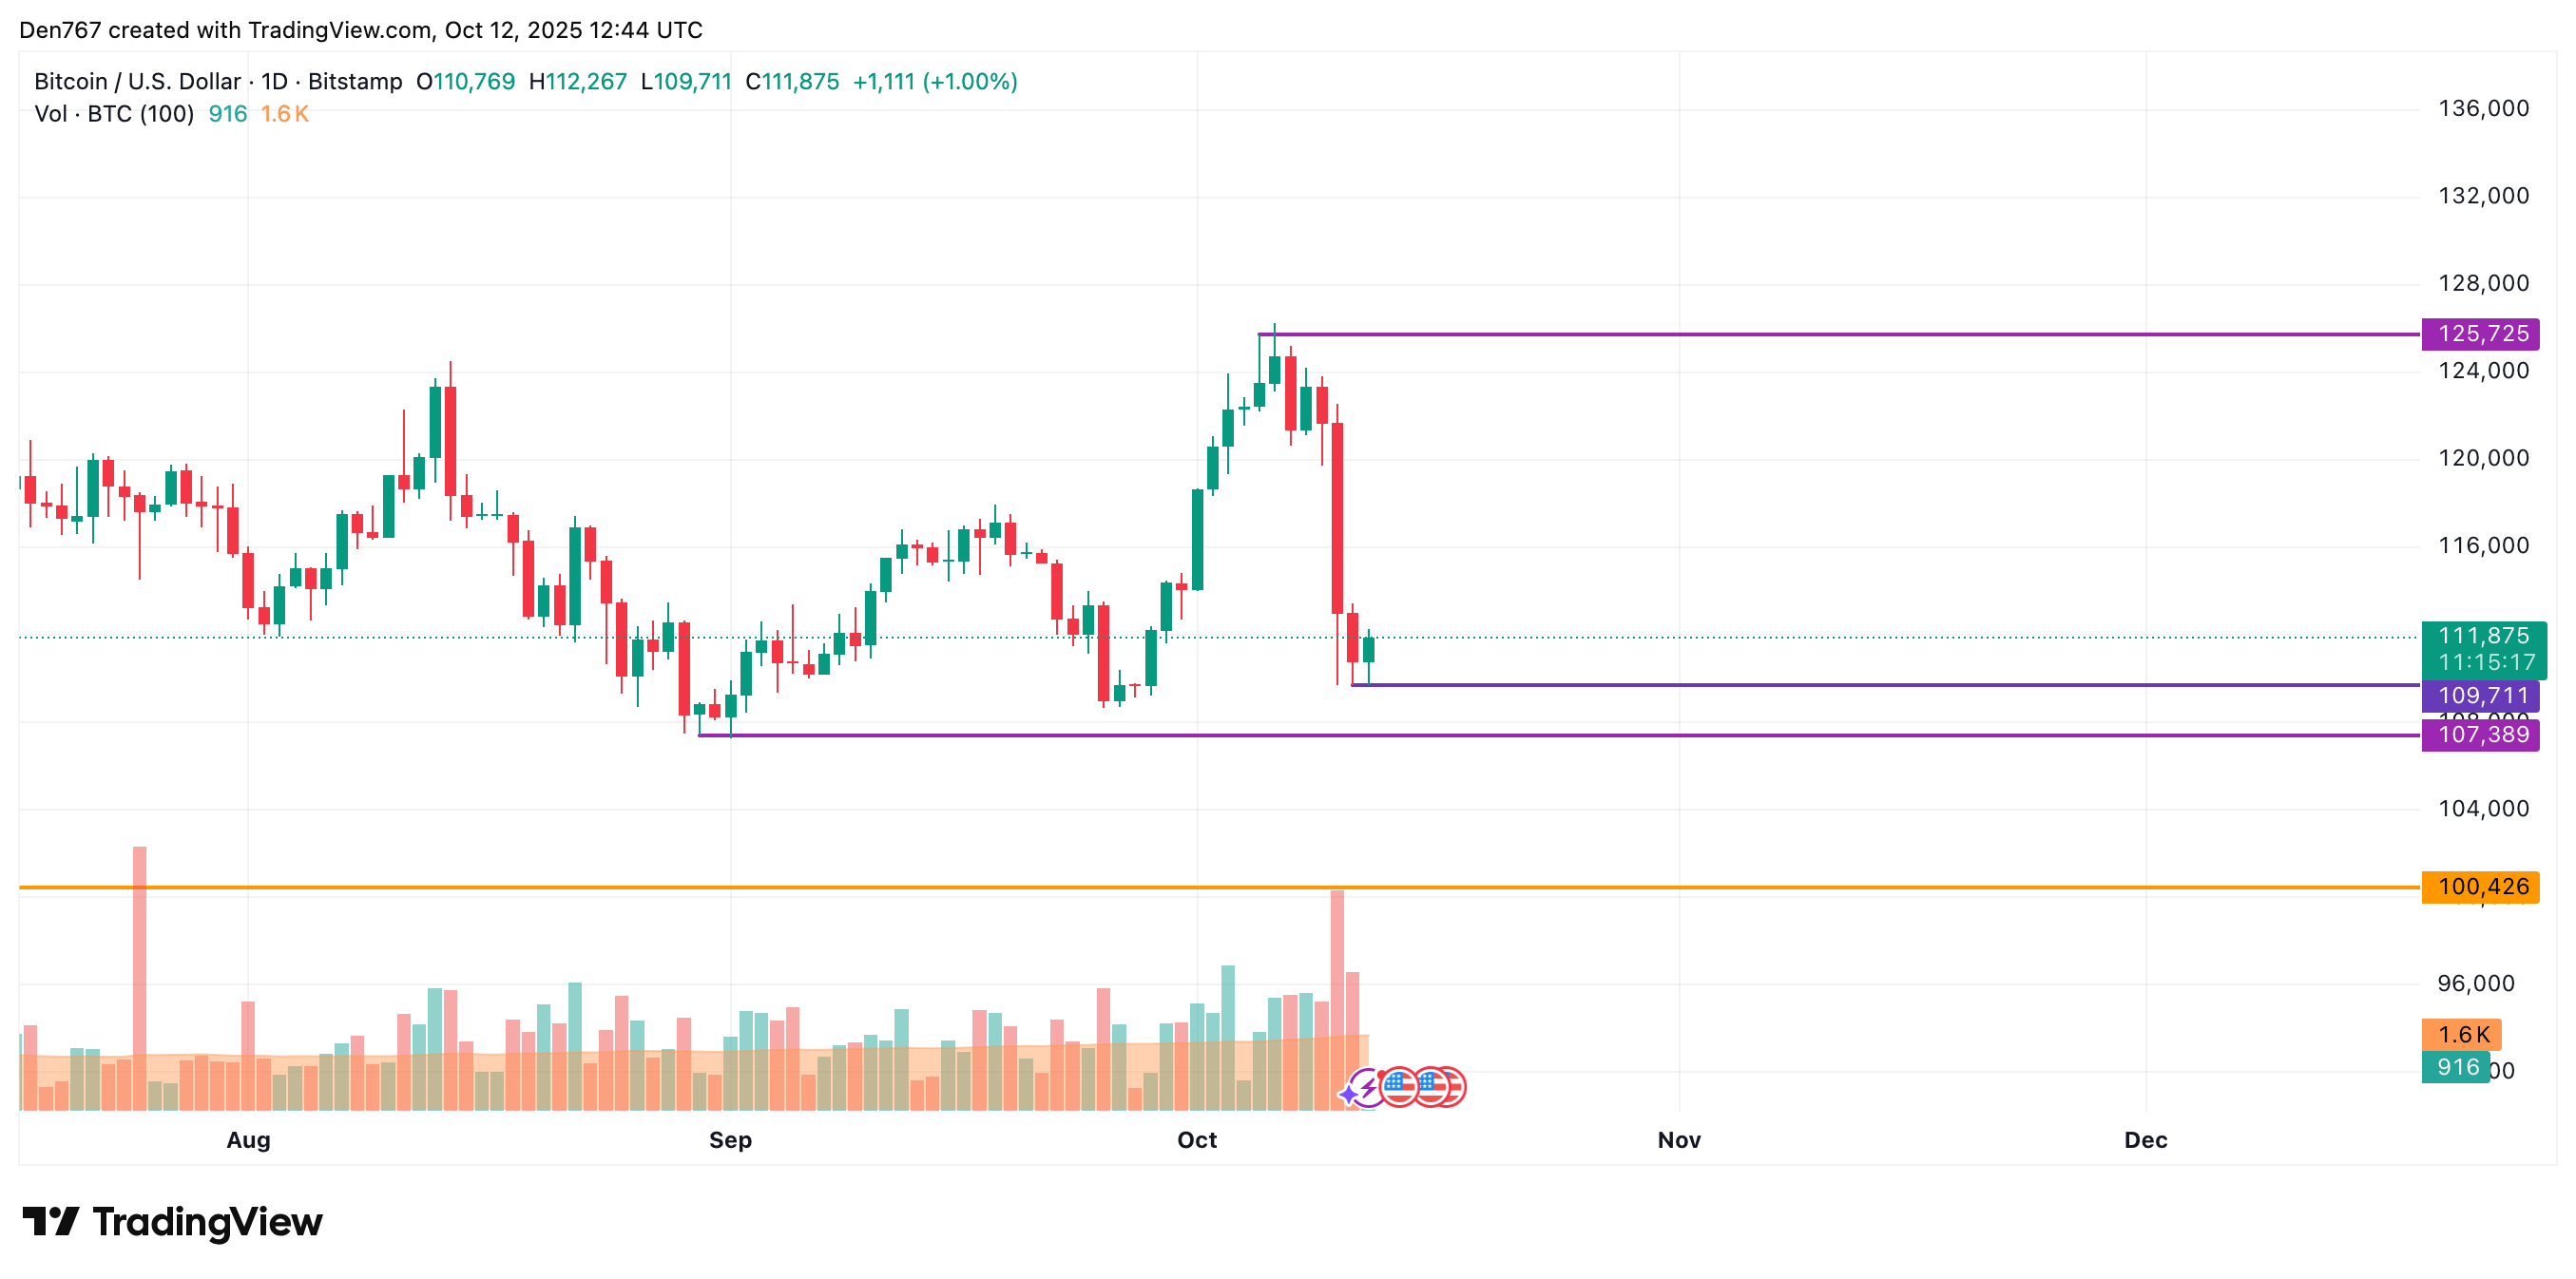
On the bigger time frame, the rate of the main crypto has set a local support at $109,711. However, buyers might need more time to accumulate energy for a further move.
In this case, sideways trading in the narrow range of $111,000-$114,000 is the more likely scenario.
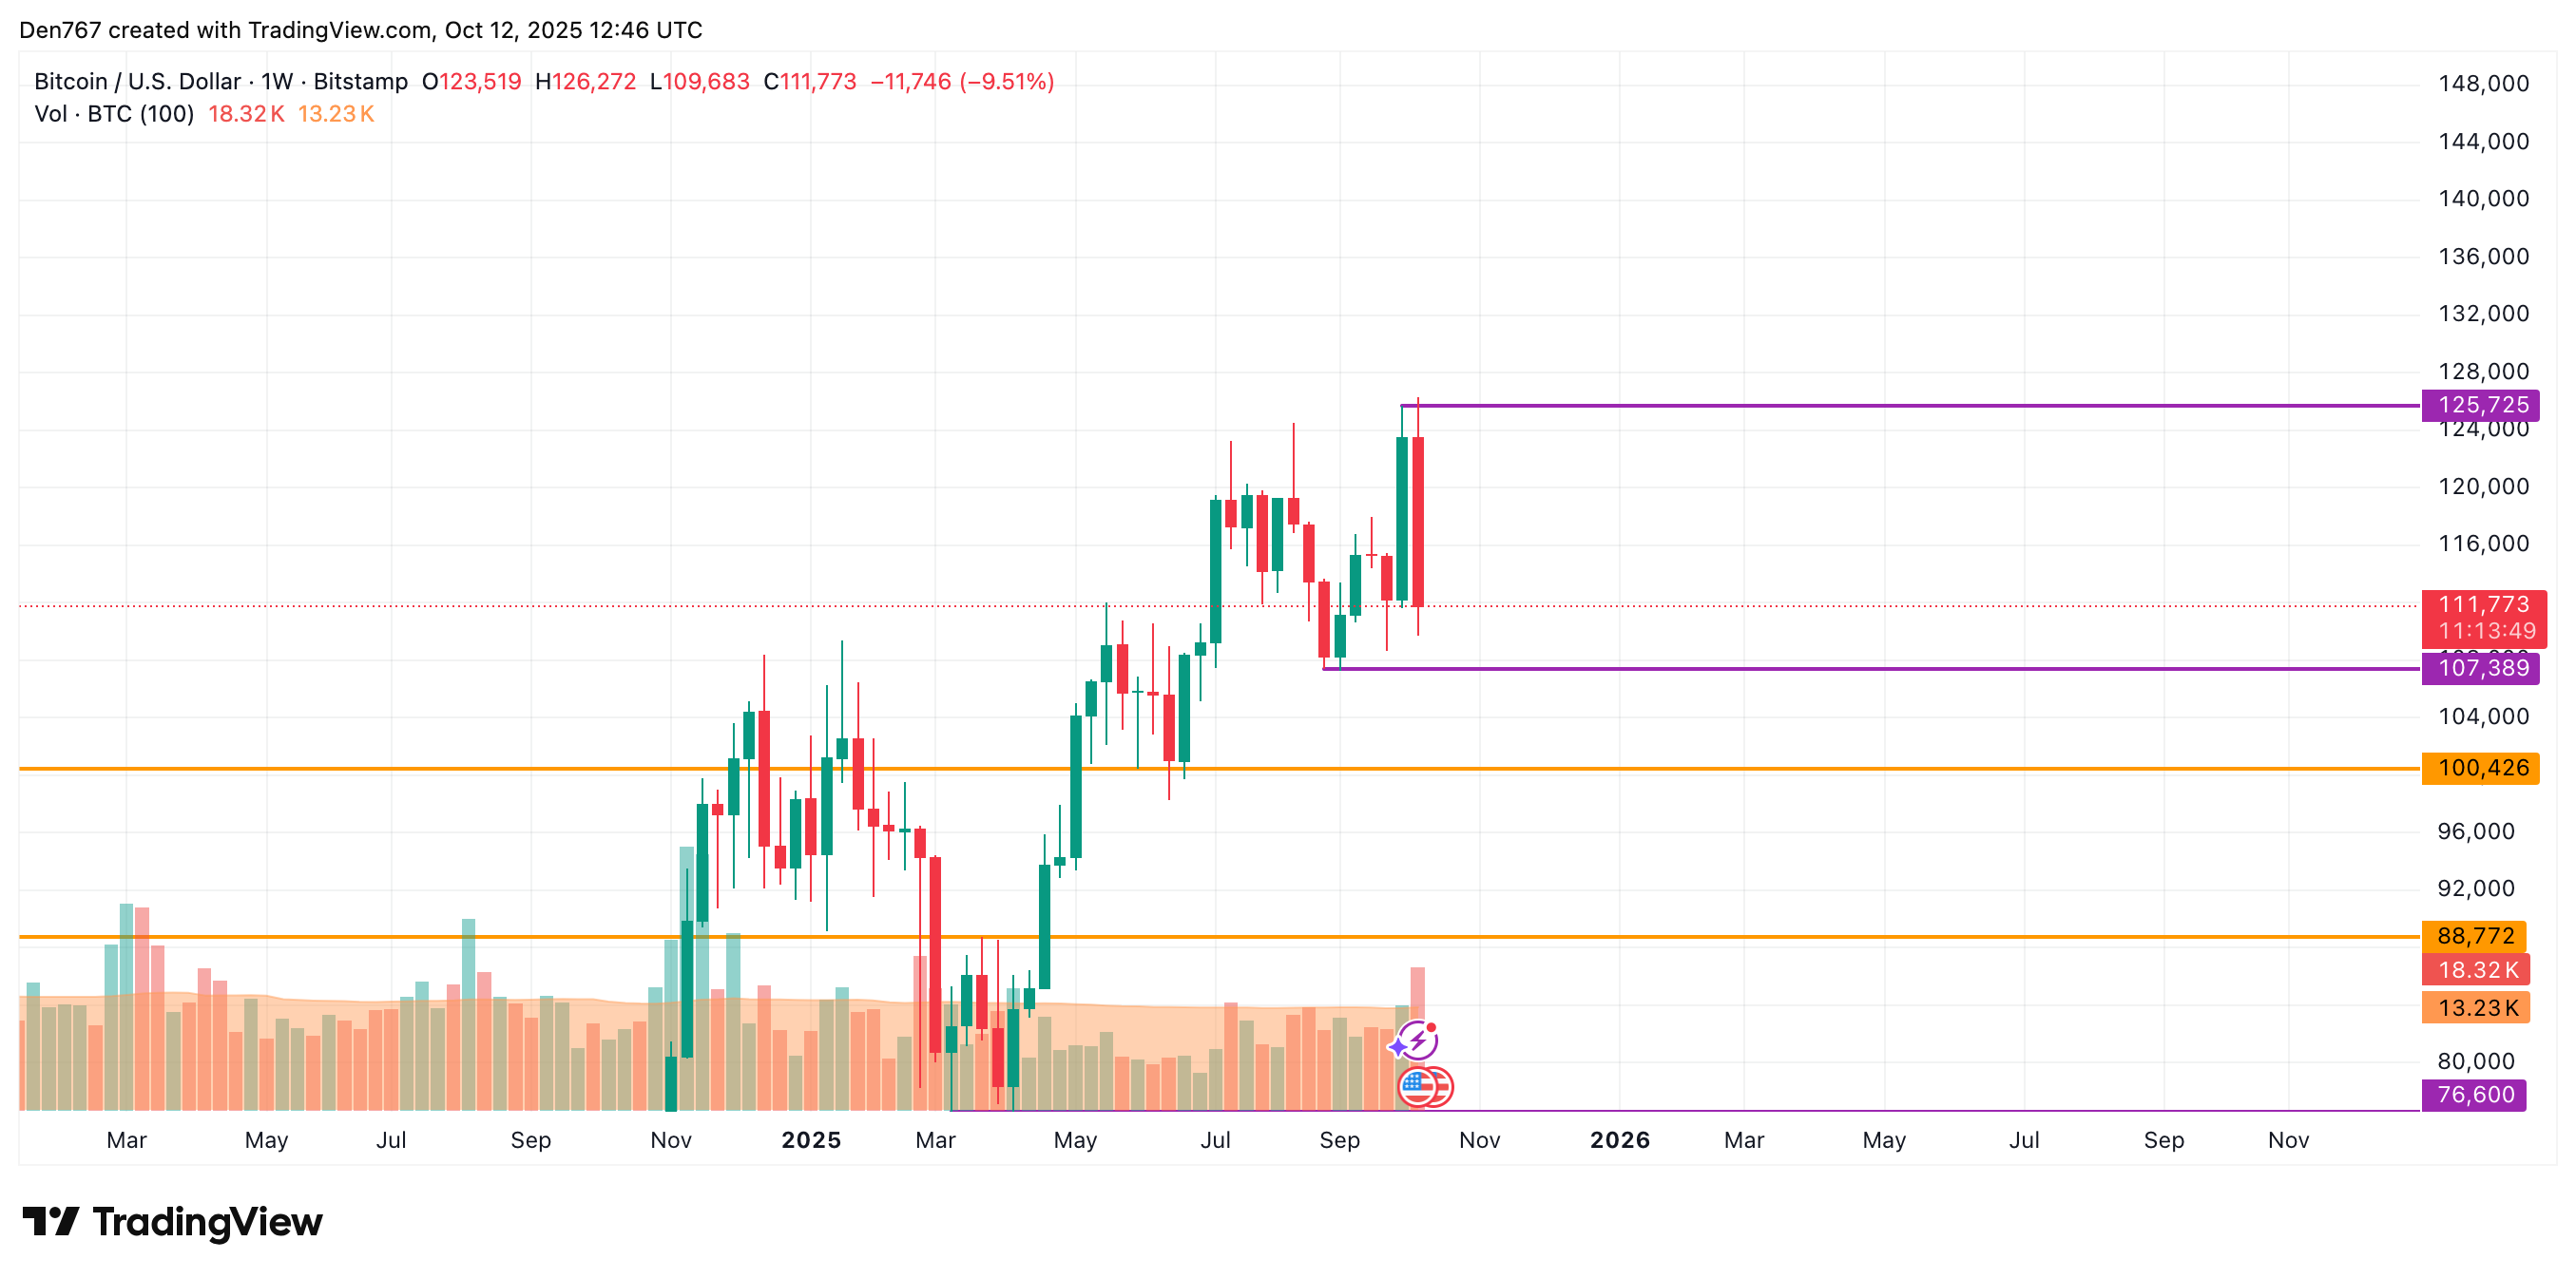
From the midterm point of view, the situation is bearish. If the weekly candle closes below the previous bar low ($111,597), there is a high probability to witness an ongoing correction to the $100,000-$105,000 area.
Bitcoin is trading at $111,773 at press time.
Disclaimer: The content of this article solely reflects the author's opinion and does not represent the platform in any capacity. This article is not intended to serve as a reference for making investment decisions.
You may also like
No wonder Buffett finally bet on Google
Google holds the entire chain in its own hands. It does not rely on Nvidia and possesses efficient, low-cost computational sovereignty.

HYPE Price Prediction December 2025: Can Hyperliquid Absorb Its Largest Supply Shock?

XRP Price Stuck Below Key Resistance, While Hidden Bullish Structure Hints at a Move To $3
Bitcoin Price Prediction: Recovery Targets $92K–$101K as Market Stabilizes