$120,000 Is Still on the Table for Bitcoin, On-Chain Data Shows

Analysts see $120,000 still in play for Bitcoin as on-chain data reveals strong accumulation among short-term holders and rising exchange flows signaling renewed strength.
Bitcoin’s price has mostly traded sideways since rebounding from Friday’s market crash, struggling to break past resistance at $115,892 while finding support near $111,098.
Despite the muted action, two analysts have identified bullish signals that could lead to a price recovery toward the $120,000 level in the near term.
Rising Binance Exchange Flows Support Bitcoin’s Ongoing Bullish Structure
CryptoQuant analyst PelinayPA noted that Bitcoin’s market structure remains intact and continues to show signs of strength despite recent headwinds.
According to the report, one of the major supporting factors is the rise in Binance exchange-to-exchange flows, a metric that tracks the transfer of Bitcoin between major trading venues.
While assessed on a 7-day moving average, CryptoQuant’s data show that it has soared 125% in the past seven days.
For token TA and market updates: Want more token insights like this? Sign up for Editor Harsh Notariya’s Daily Crypto Newsletter.
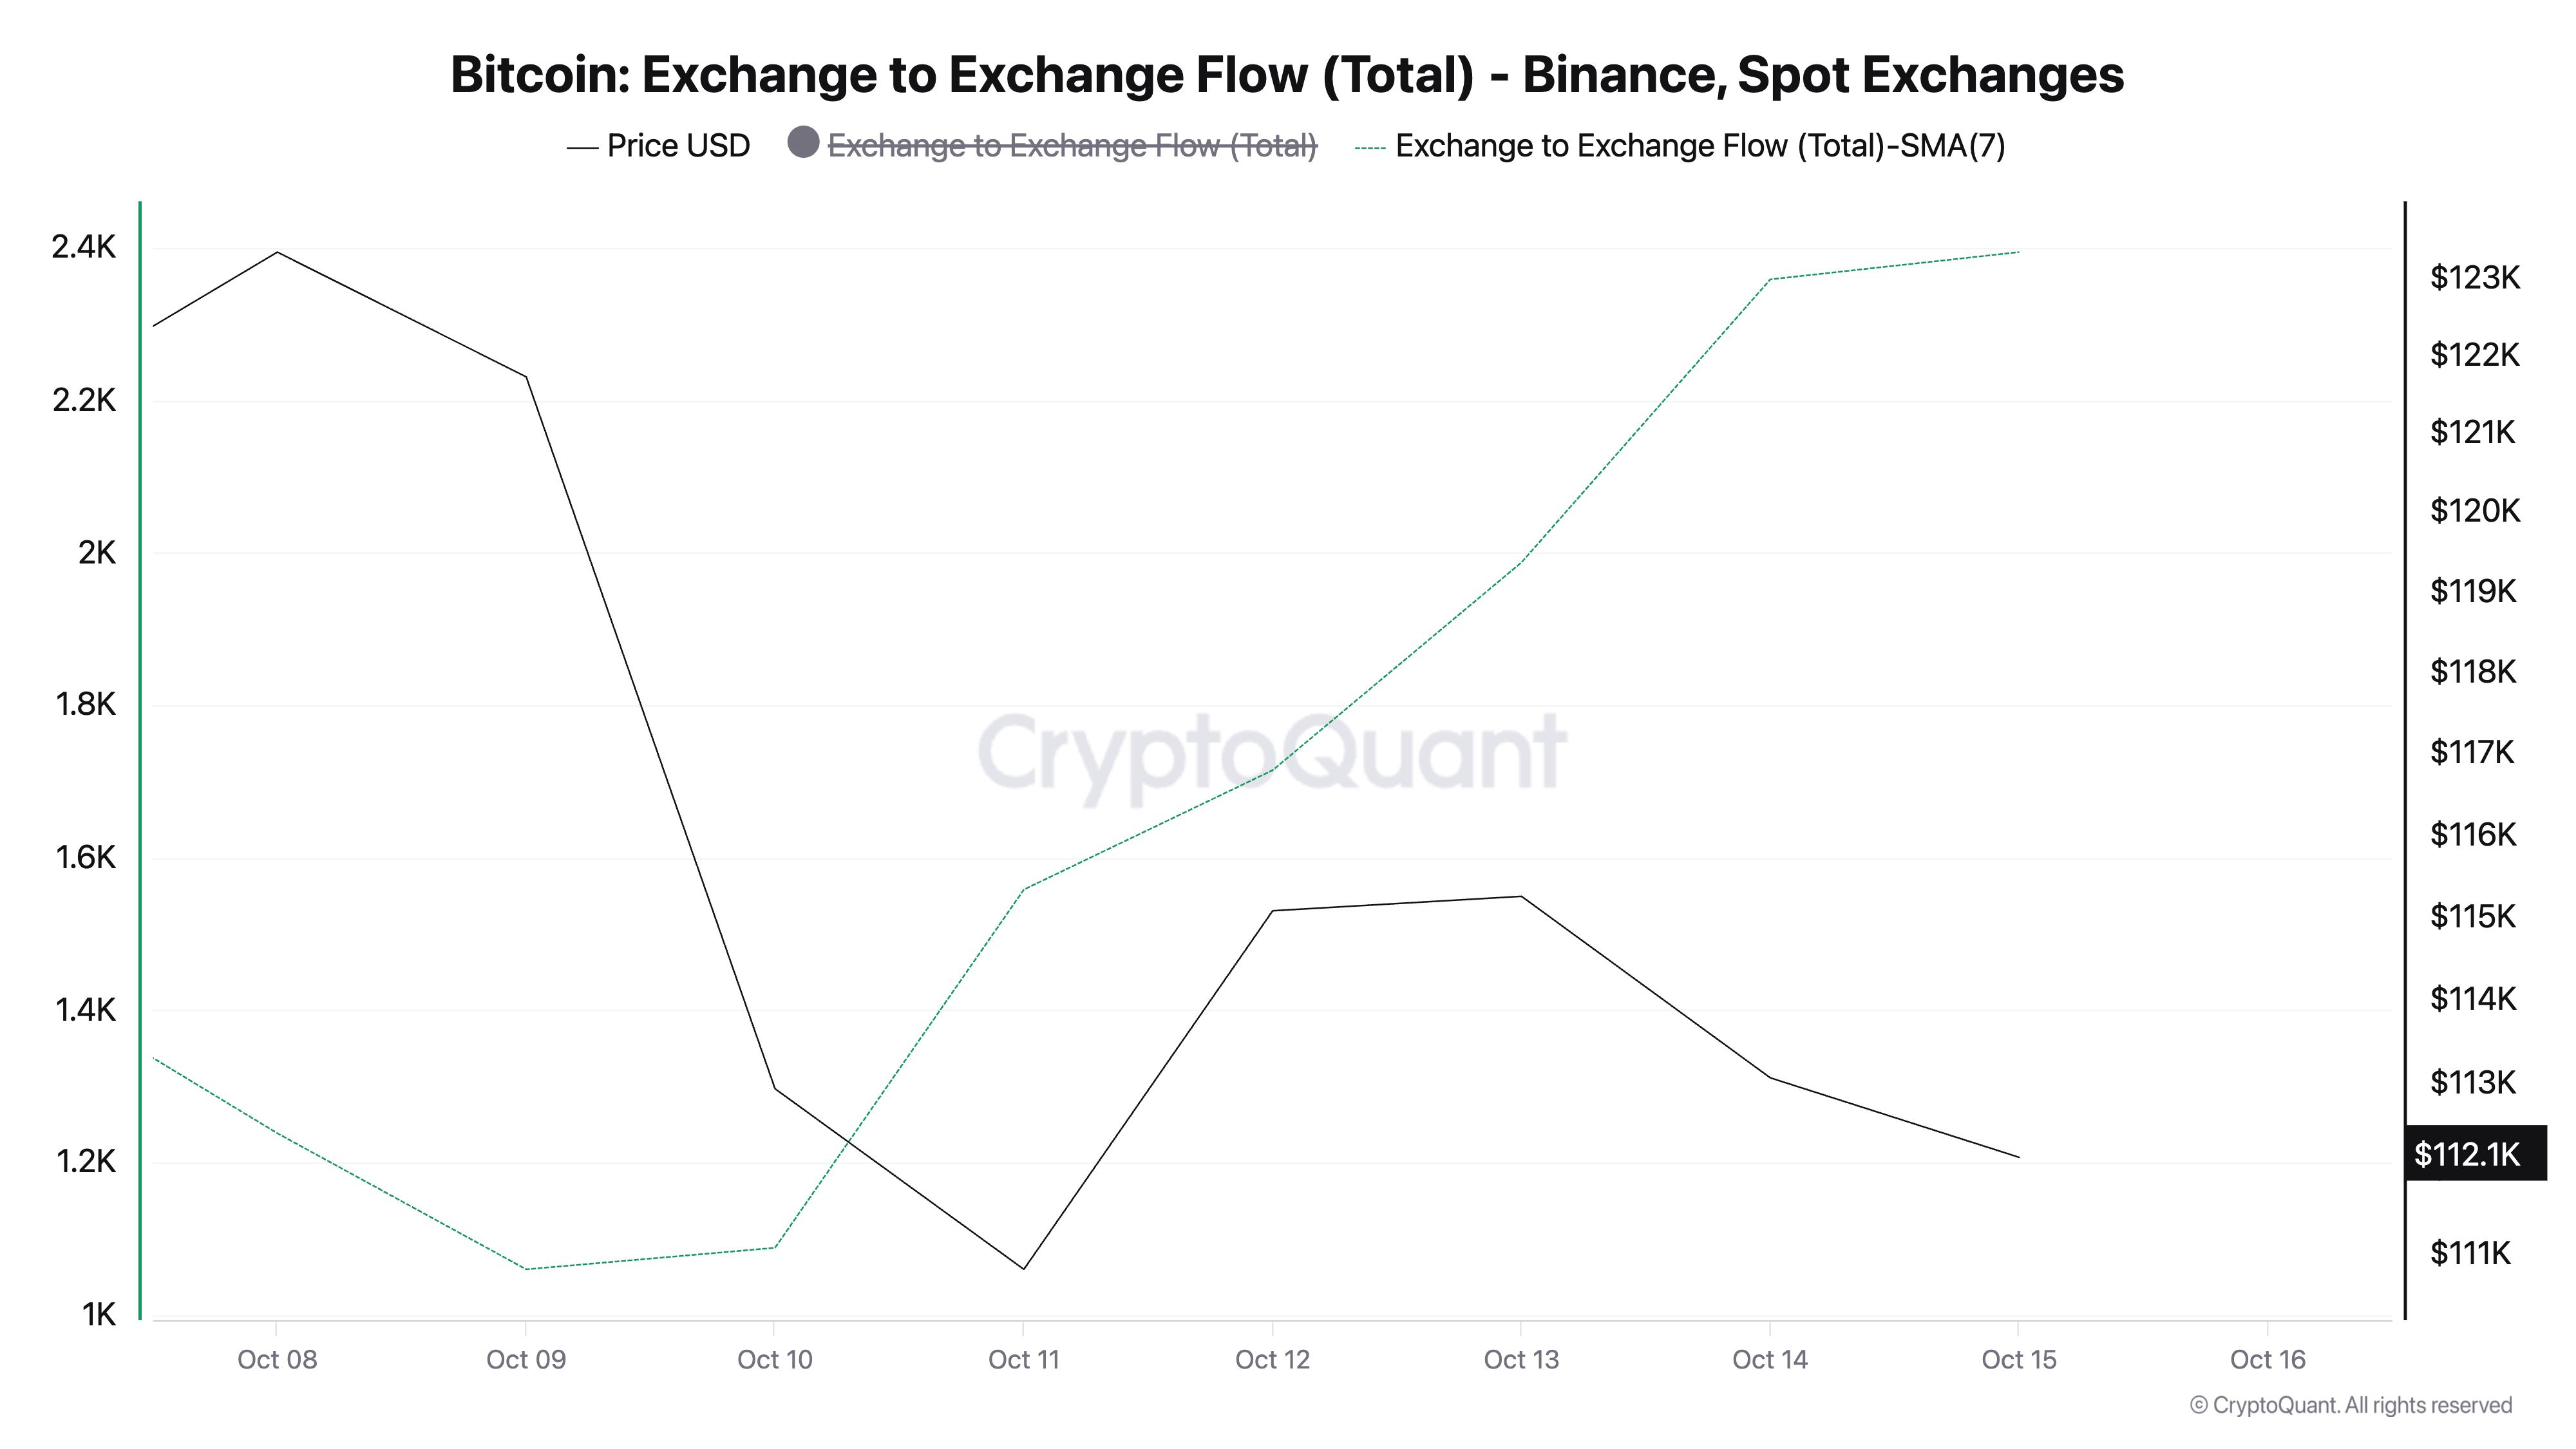 Bitcoin Exchange to Exchange Flow. Source:
CryptoQuant
Bitcoin Exchange to Exchange Flow. Source:
CryptoQuant
When exchange-to-exchange flows rise, it indicates heightened activity among large traders, institutions, or market-making entities moving funds between major exchanges.
“Since early October, these flows have risen again, implying renewed activity among large players. However, because these are transfers between exchanges rather than inflows to exchanges, they are interpreted as neutral to slightly positive, suggesting that spot holdings are being redistributed rather than sold,” PelinayPA noted.
The analyst said that this behavior indicates redistribution of liquidity rather than capitulation, a healthy sign for market stability.
“Following the sharp drop on October 11, Bitcoin recovered quickly and has stabilized around $110K. The flow volumes during that sell-off were significantly lower than current levels, indicating that the latest movements reflect a more organic and healthy recovery. Technically, the probability of revisiting the October 11 low is low. The price structure continues to form higher lows, with no visible loss of momentum.”
The analyst added that Bitcoin could test the $115,000 resistance zone if the bullish momentum holds. A confirmed breakout above $115,000–$120,000 may trigger a new wave of upward momentum.
Short-Term Holder Accumulation Points to Renewed Retail Confidence
Another pseudonymous CryptoQuant analyst, Crazzyblockk, shared the bullish sentiment in a different report, highlighting a surge in BTC holdings among short-term investors.
According to the analyst, despite Friday’s liquidation event triggering “considerable despair and a widespread reluctance among traders to commit to heavy leverage positions in the futures market,” there is a strong accumulation trend among Short-Term Holders (STHs).
“A critical on-chain metric — the supply held by New Investors (or Short-Term Holders, STHs, typically defined as those holding coins for less than 1 month) — is flashing a profoundly bullish signal: rapid accumulation is underway.”
He added that this renewed buying activity marks an important shift in sentiment following the recent market downturn.
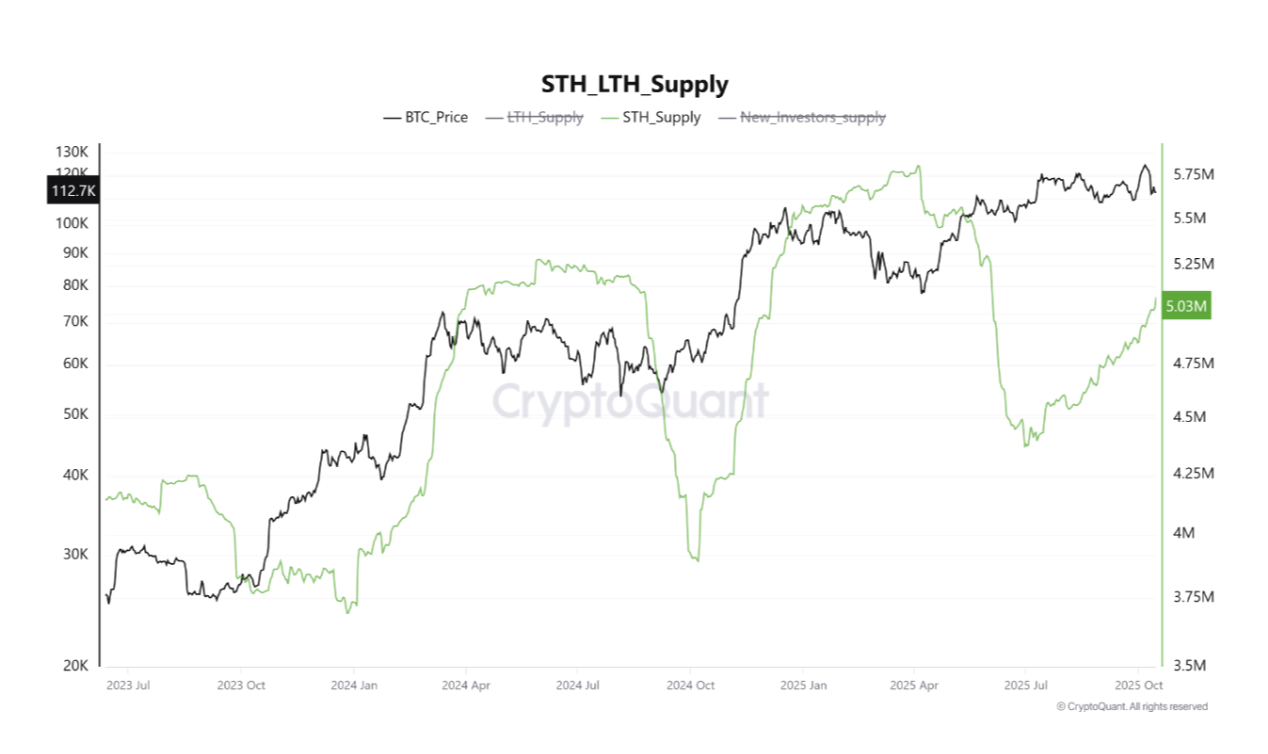 BTC STH Supply. Source:
CryptoQuant
BTC STH Supply. Source:
CryptoQuant
“As confirmed by the underlying metric data, this cohort of new market entrants has rapidly increased their Bitcoin holdings, with STH supply swelling by a substantial volume in a short period. For instance, recent figures show this supply rising from approximately 1.6 million BTC to over 1.87 million BTC in just a matter of days. This represents a significant injection of fresh capital and demand following the price drawdown,” the analyst wrote.
Bitcoin’s Next Move: Break Above $115,000 or Slip Below $111,000?
Both reports suggest that BTC’s on-chain activity is quietly strengthening even as price action remains range-bound. Rising institutional flows and fresh retail accumulation could set the stage for a push above $115,892 in the near term.
A successful breach of this resistance could open the door for a rally toward $120,144.
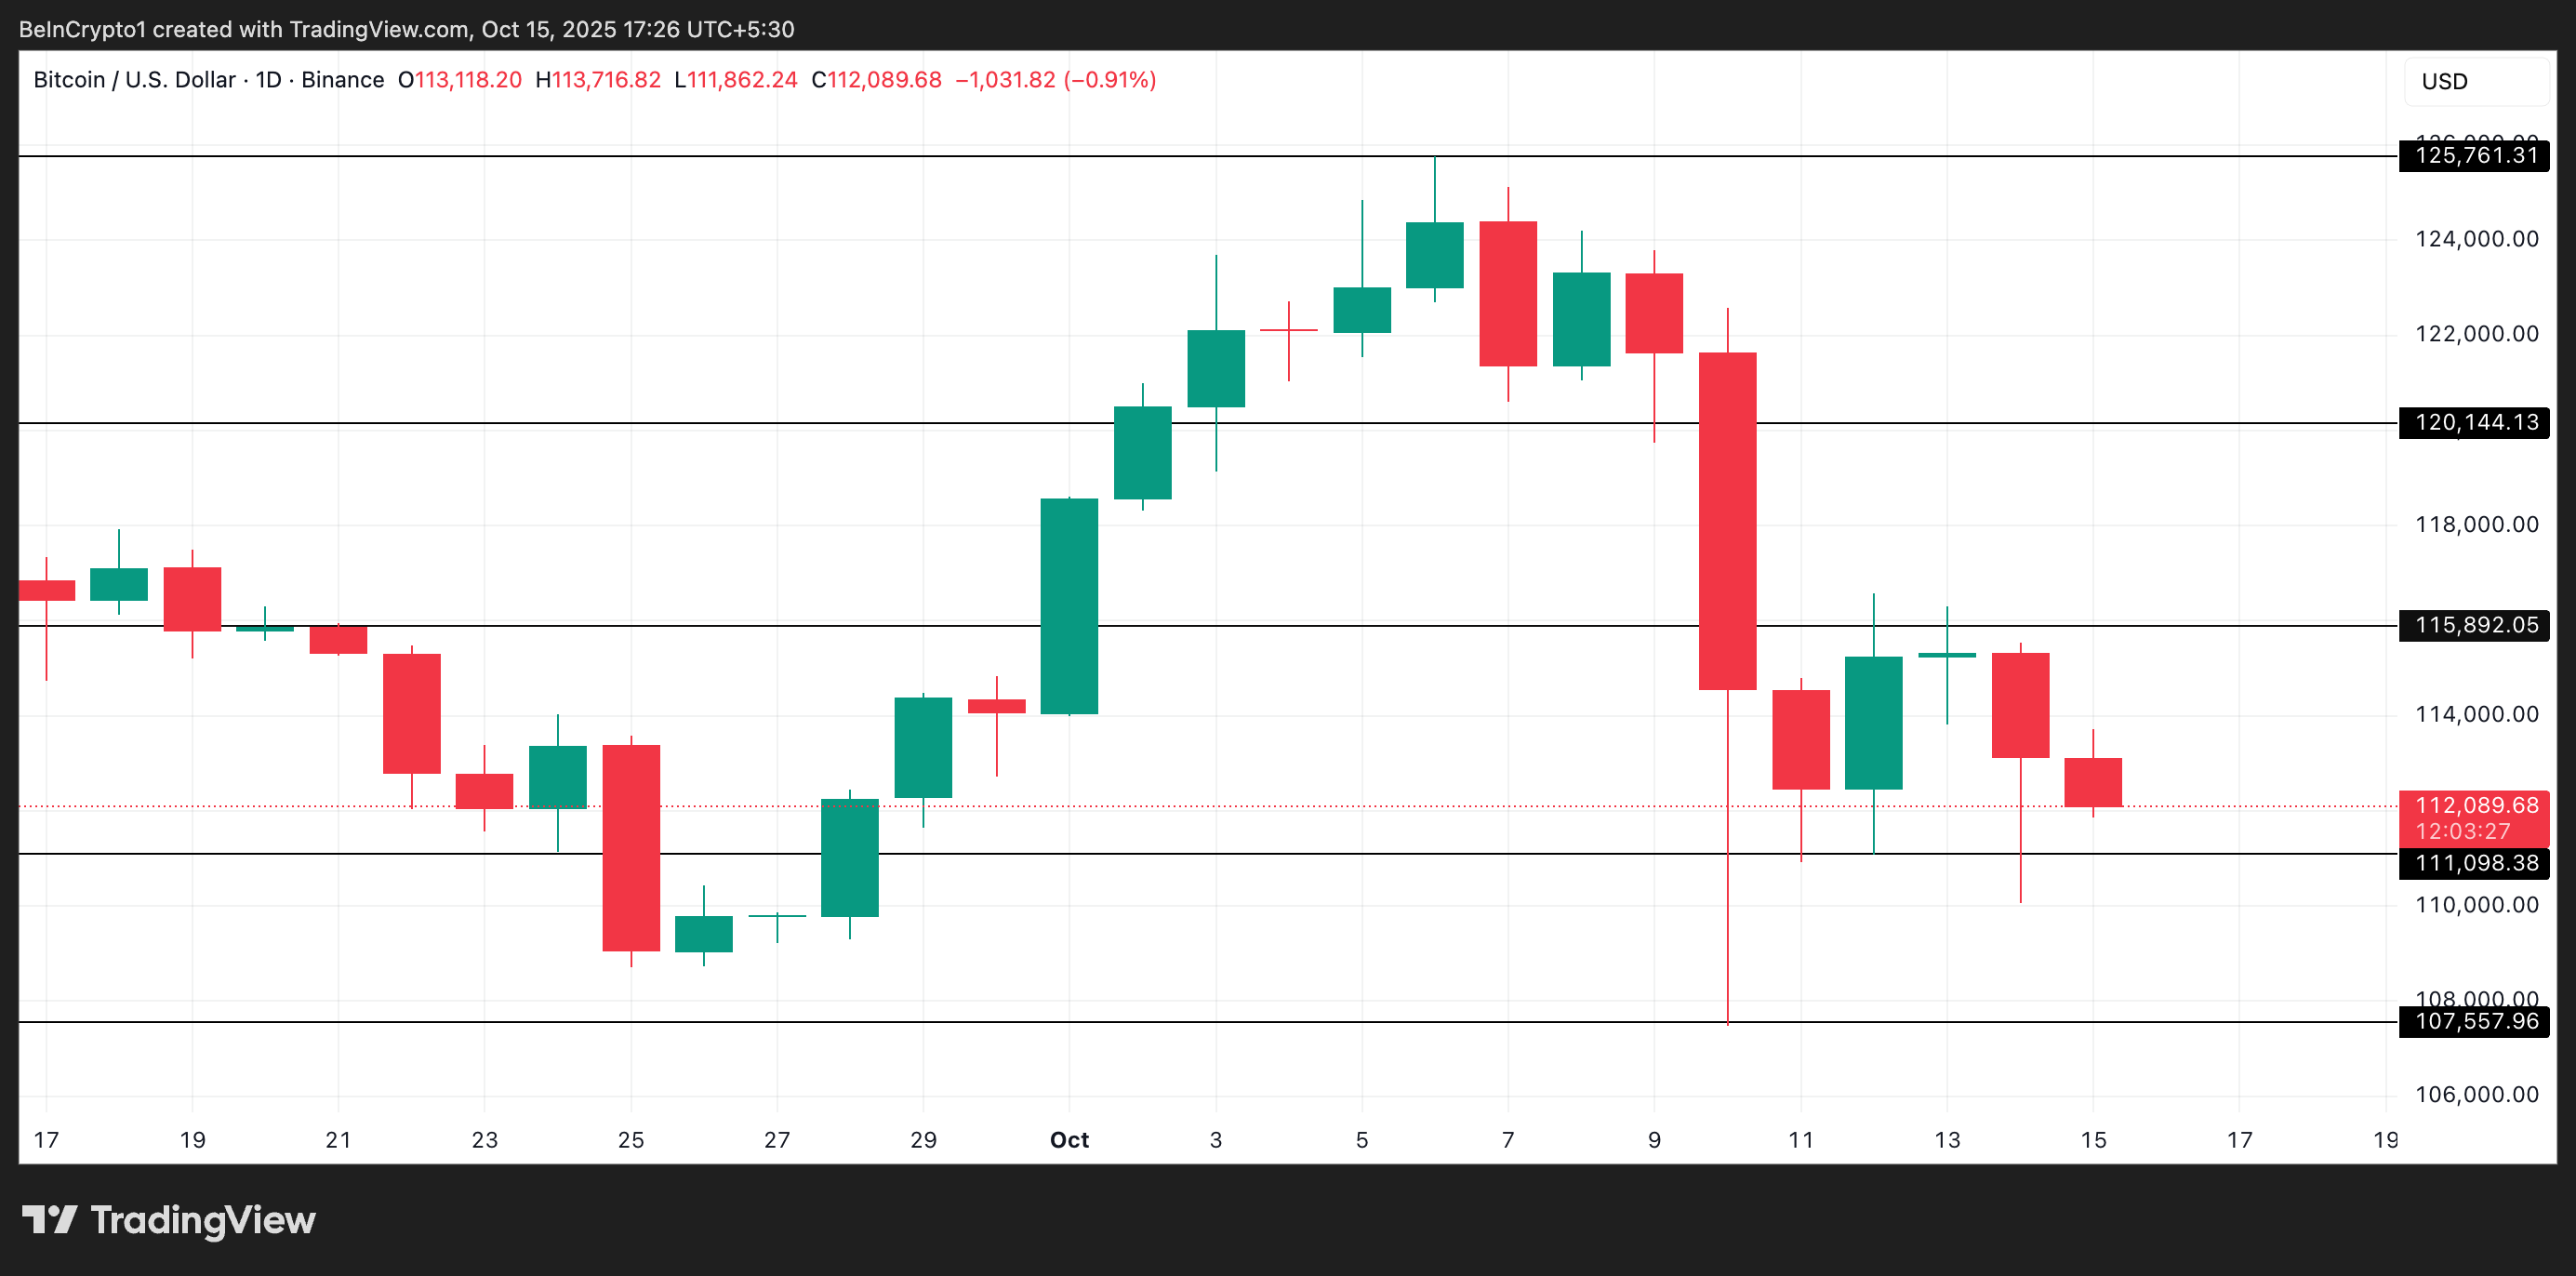 BTC Price Analysis. Source:
TradingView
BTC Price Analysis. Source:
TradingView
However, if this buying trend stalls, BTC may extend its consolidation or even trend lower below $111,098.
Disclaimer: The content of this article solely reflects the author's opinion and does not represent the platform in any capacity. This article is not intended to serve as a reference for making investment decisions.
You may also like
The PENGU USDT Sell Alert: Is This a Turning Point for Stablecoin Approaches?
- PENGU/USDT's 2025 collapse triggered a $128M liquidity shortfall, exposing algorithmic stablecoin fragility and accelerating market shift to regulated alternatives. - USDC's market cap surged to $77.6B by 2025, while MiCA-compliant euro-stablecoins gained $680M in cross-border adoption amid regulatory clarity. - DeFi protocols adopted oracle validation and reserve-backed models post-PENGU, reducing exploit losses by 90% since 2020 through institutional-grade security upgrades. - Regulators now prioritize

Emerging Prospects in EdTech and AI-Powered Learning Systems: Ways Educational Institutions Are Transforming Programs and Enhancing Student Achievement
- AI is transforming education by reshaping curricula, enhancing student engagement, and optimizing institutional efficiency. - Universities like Florida and ASU integrate AI literacy across disciplines, offering microcredentials and fostering innovation. - AI tools like Georgia Tech’s Jill Watson and Sydney’s Smart Sparrow boost performance and engagement through personalized learning. - AI streamlines administrative tasks but faces challenges like ethical misuse and skill gaps, requiring structured train

Anthropological Perspectives on Technology and Their Impact on Education and Workforce Preparedness for the Future
- Interdisciplinary STEM/STEAM education integrates technology tools like AI and VR to bridge theory and real-world skills, driven by $163B global edtech growth. - U.S. faces 411,500 STEM teacher shortages and 28% female workforce representation gaps, prompting equity-focused programs like Girls Who Code. - STEM occupations earn $103K median wages (vs. $48K non-STEM), with 10.4% job growth projected through 2033, driving investor opportunities in edtech and workforce alignment. - Strategic investments in t

The Revival of Educational Technology in Higher Education After the Pandemic
- Global EdTech market grows to $7.3T by 2025, driven by hybrid learning and AI/AR/VR adoption in higher education. - Institutions like MIT and Harvard integrate AI across disciplines, boosting enrollment and workforce alignment through $350M-$500M investments. - EdTech platforms enabling personalized learning and immersive experiences see rising demand, with 45% annual growth in AI-related programs since 2020. - Undervalued EdTech stocks offer investment opportunities as $16B+ VC funding accelerates innov