

- The short-term market equilibrium and reduced volatility are seen in the range of XRP between the support and resistance of $2.36 and $2.48 respectively.
- Liquidity heatmaps indicate that the most active leveraged positions and liquidations are in the range of $2.402.48.
- The XRP/BTC crossed 0.8 percent and was comparatively stable across the markets despite deteriorating its weekly performance.
XRP has been very active in the charts, and the recent trading sessions are indicative of higher volatility and solid market presence. The price of the cryptocurrency is at the moment of $2.48 which is a decrease of 5.2 percent in the last seven days.
Although the weekly decline has occurred, buying force seems to have settled around the support of the price at $2.36, whereas, the resistance is strong at $2.48. According to market observers, the price movement of XRP is strongly linked to the trading range of the coin as investors wait until they see a decisive breakout.
Technical Indicators Indicate Strength in Market Activity
The Relative Strength Index (RSI) of the hourly chart lies at 66.09, a bit above the neutral area. This reading implies an upward trend with XRP moving towards short term overbought states. The MACD indicator in the meantime indicates a positive movement and the values are in the range of 1.33B, indicating the strengthening of short term demand.
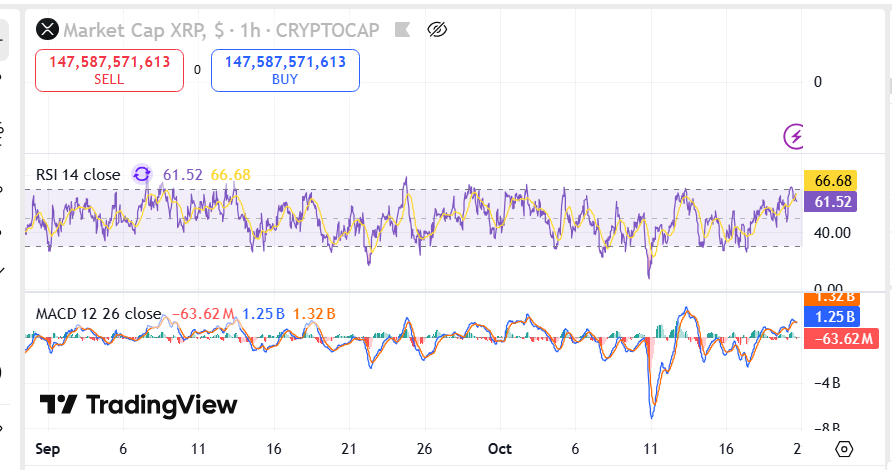 Source: TradingView
Nonetheless, the histogram indicates oscillating momentum phases, indicating how well the buyers and sellers are competing to gain control. These are signs of a high trading session as the volume changes according to the movement of XRP towards resistance. The rising purchasing interest, accompanied by the stable RSI, reflects the presence of confidence at the existing market levels.
Support and Resistance Levels Define Near-Term Range
The level of support at the price of $2.36 is still a source of price stability. It can be observed in the market records that this zone has already taken up several selling attempts and thus it has not been able to keep going down. On the other hand, the resistance level of $2.48 is a very important ceiling. The movement of prices to this range is likely to cause short term profit-taking, and restrict gains in the short term.
The presence of this tight price range implies that XRP is trading in a disciplined range. In case the price remains stable at a level of above $2.36, investors can expect a greater response at the resistance level.
Market Outlook and Ongoing Developments
The overall market capitalization of XRP is about 147.8 billion evenly distributed between the buy and sell sides. The uniform trades made indicate a market that is set to have directional clarity. Furthermore, the comparative advantage of both technical indicators highlights the ability of XRP to maintain the interest amidst the more general changes in the market.
Due to the dynamics of the market, traders are still following RSI and MACD developments in the event of a shift in short-term momentum. Its existing structure represents a balance between fear and hope, underlining the necessity of a long-term volume to lead to the next stage of motion.