
HBAR Heads Toward a Crash Site — One Level Stands Between Price and the Fall

HBAR sits on the edge of a bearish breakdown. One key level, at $0.160, decides whether the head-and-shoulders pattern completes or gets invalidated.
HBAR price is down almost 1% today and has traded flat over the past month. It is up 5.7% in the last seven days, but that bounce does not change the bigger picture.
The chart is close to forming a bearish structure that points to a deeper drop unless one level holds.
Bearish Pattern Forms as Two Risks Amplify
HBAR is close to completing a head-and-shoulders pattern on the daily chart. If price slips below the neckline, the setup signals a potential 28% decline. This pattern is not confirmed yet, but it sits near completion — and the next moves depend heavily on volume behavior.
Want more token insights like this? Sign up for Editor Harsh Notariya’s Daily Crypto Newsletter.
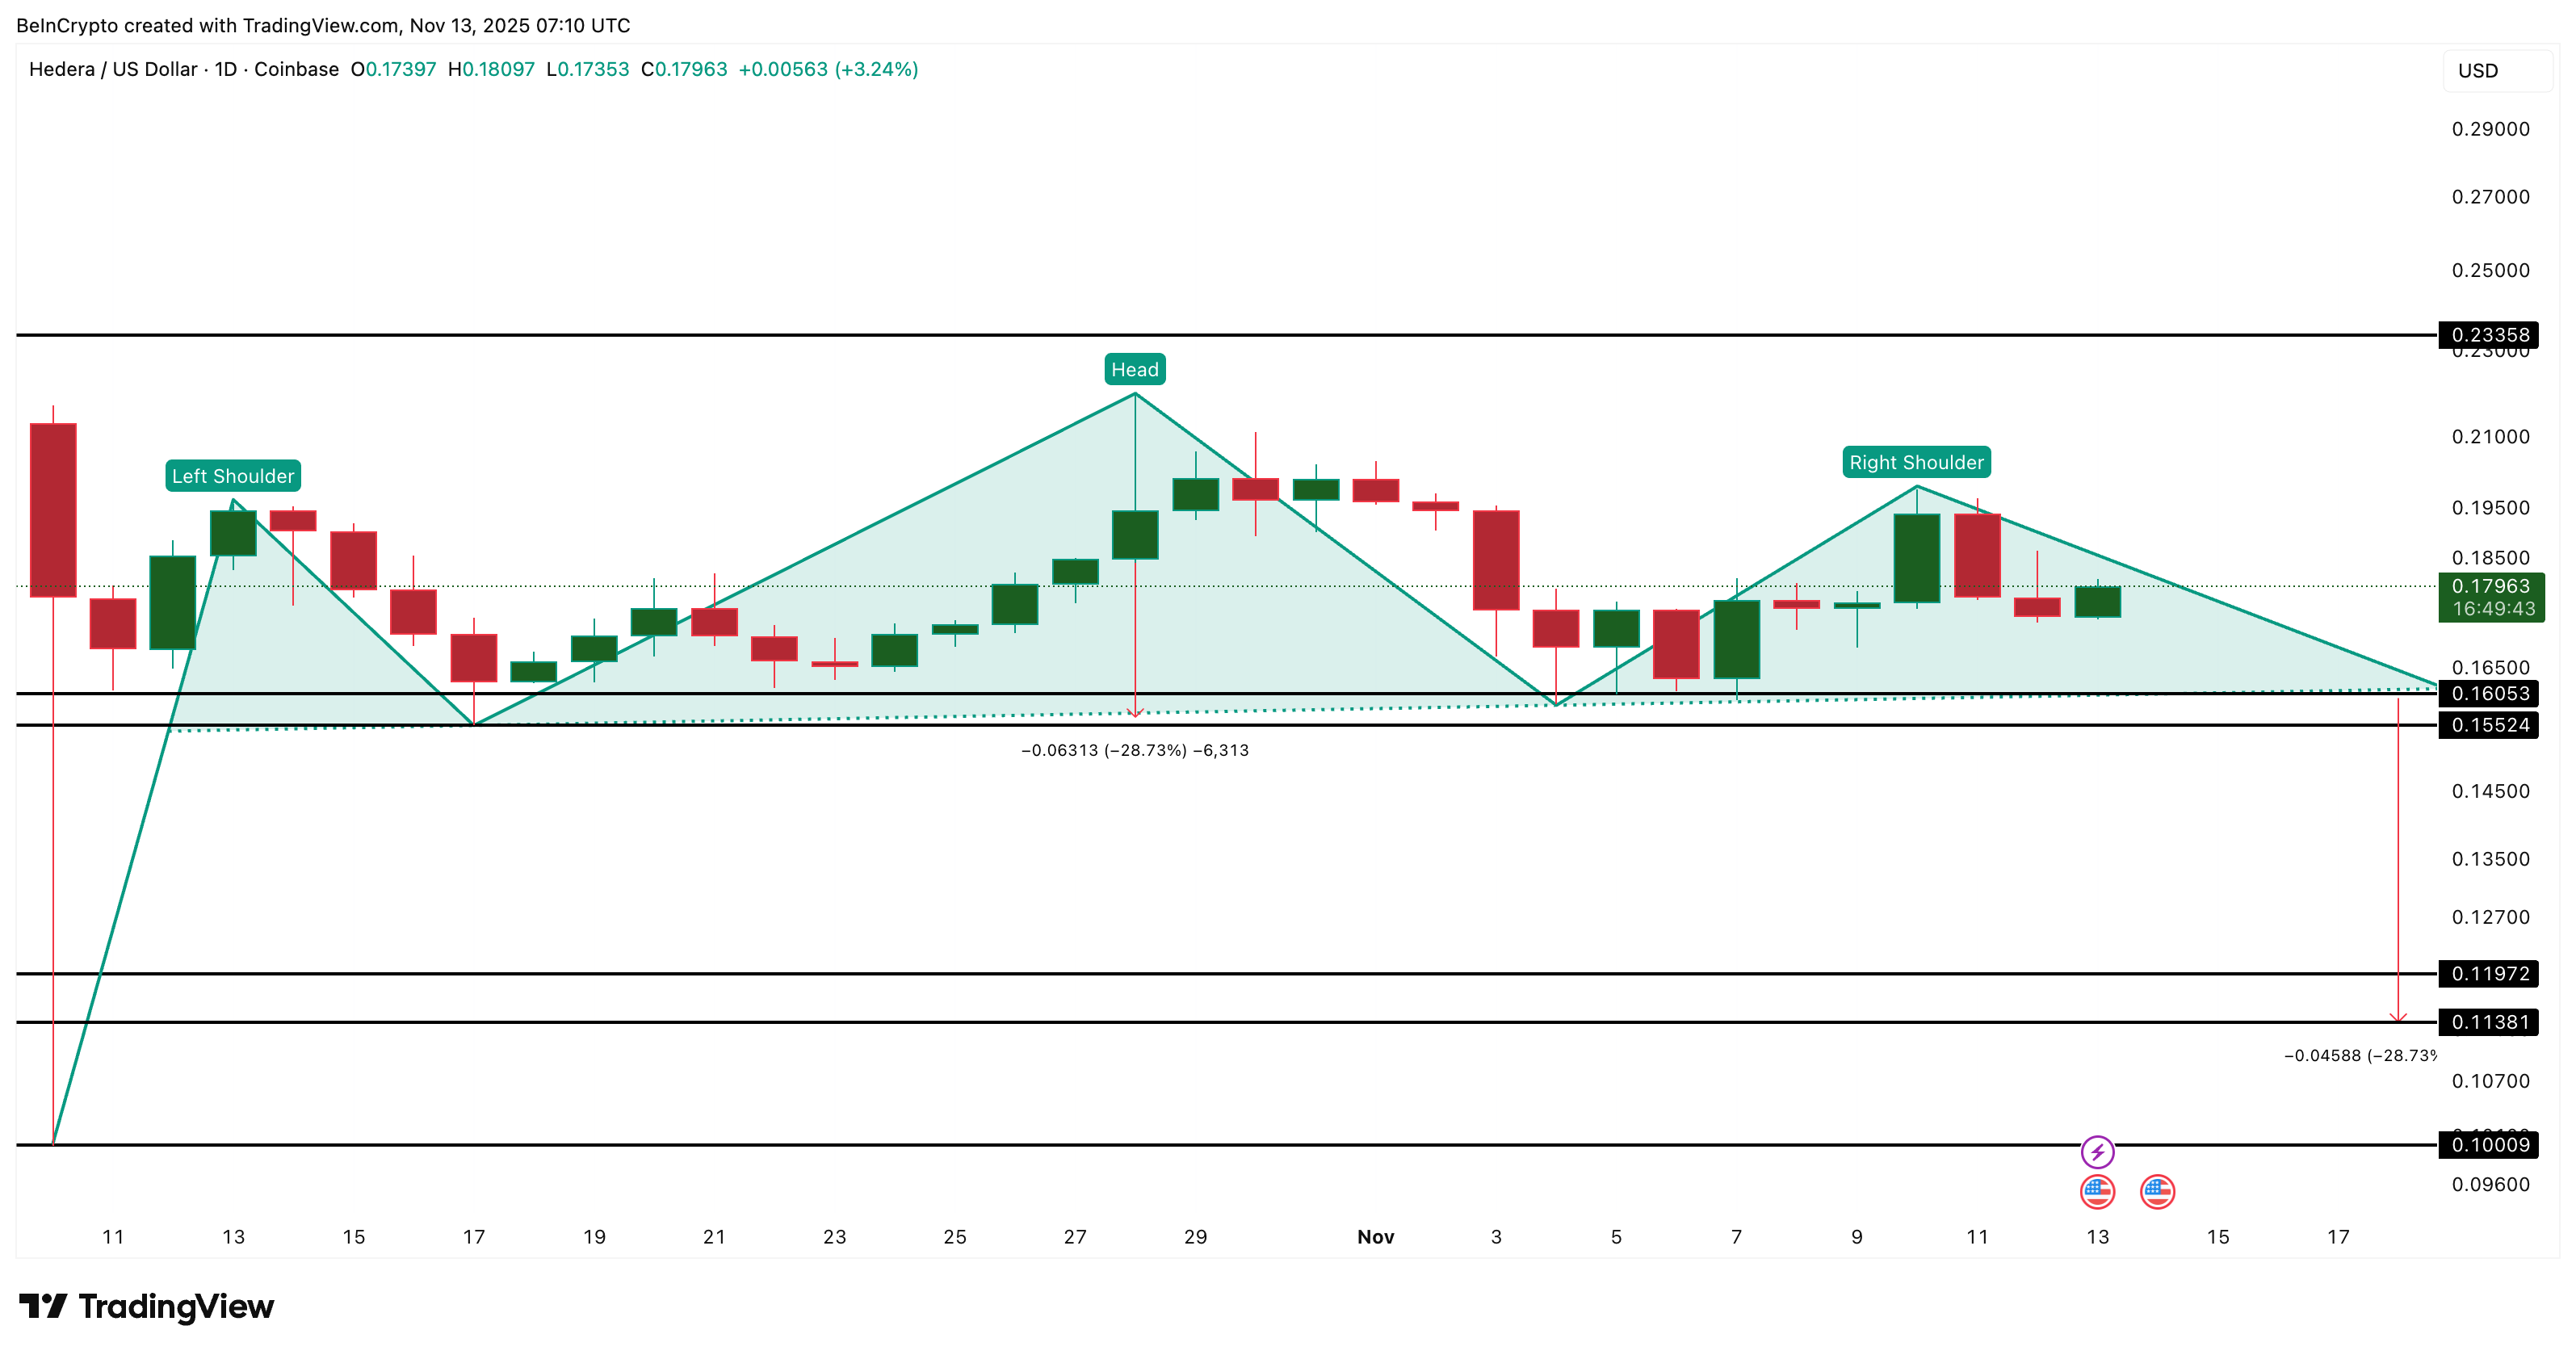 Head And Shoulders Pattern At Work:
TradingView
Head And Shoulders Pattern At Work:
TradingView
That brings the focus to On-Balance Volume (OBV), a tool that tracks whether volume is flowing into or out of the asset. OBV has been rising slowly along an ascending trendline since 23 October, but this is not a strong signal.
Each time OBV drifts toward the lower edge of this trendline, HBAR price pulls back, showing that buyers are barely holding momentum. OBV is now back at the edge again, which increases the risk of a breakdown. If OBV slips under this line, the head-and-shoulders setup gains momentum.
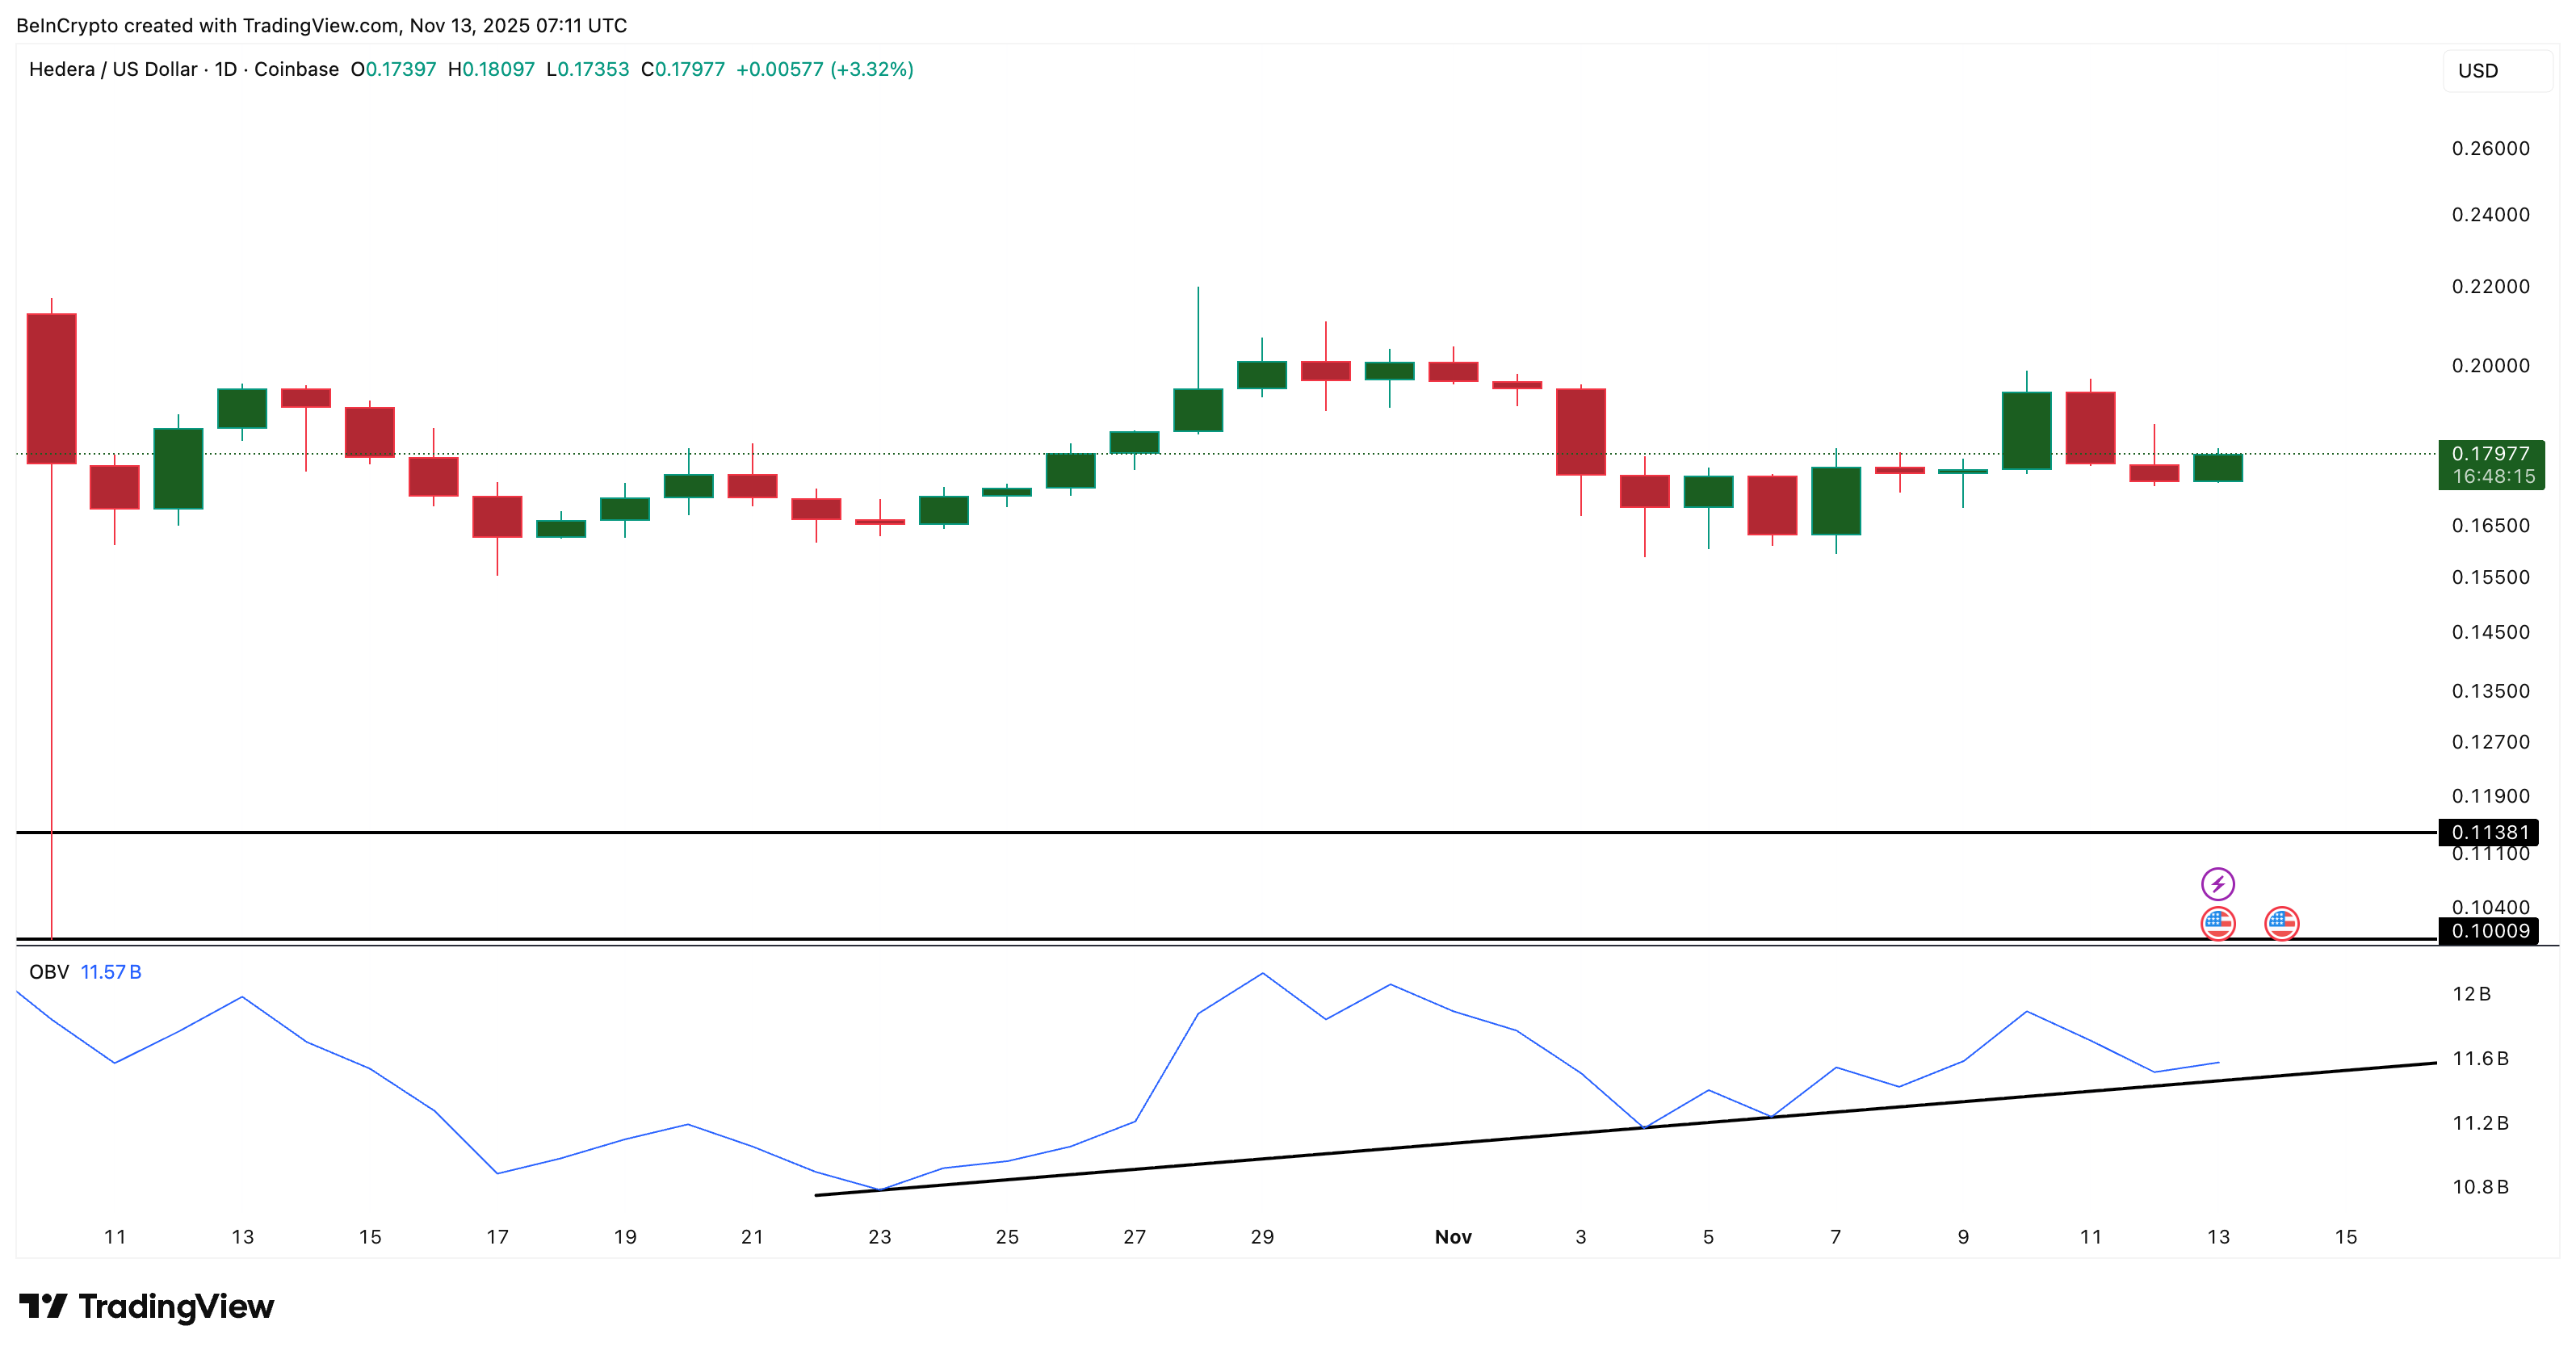 HBAR Needs Volume Support To Avoid Crash:
TradingView
HBAR Needs Volume Support To Avoid Crash:
TradingView
A second risk comes from the leverage map. Over the past seven days on Bitget alone:
- Long liquidations: 17.95 million
- Short liquidations: 14.34 million
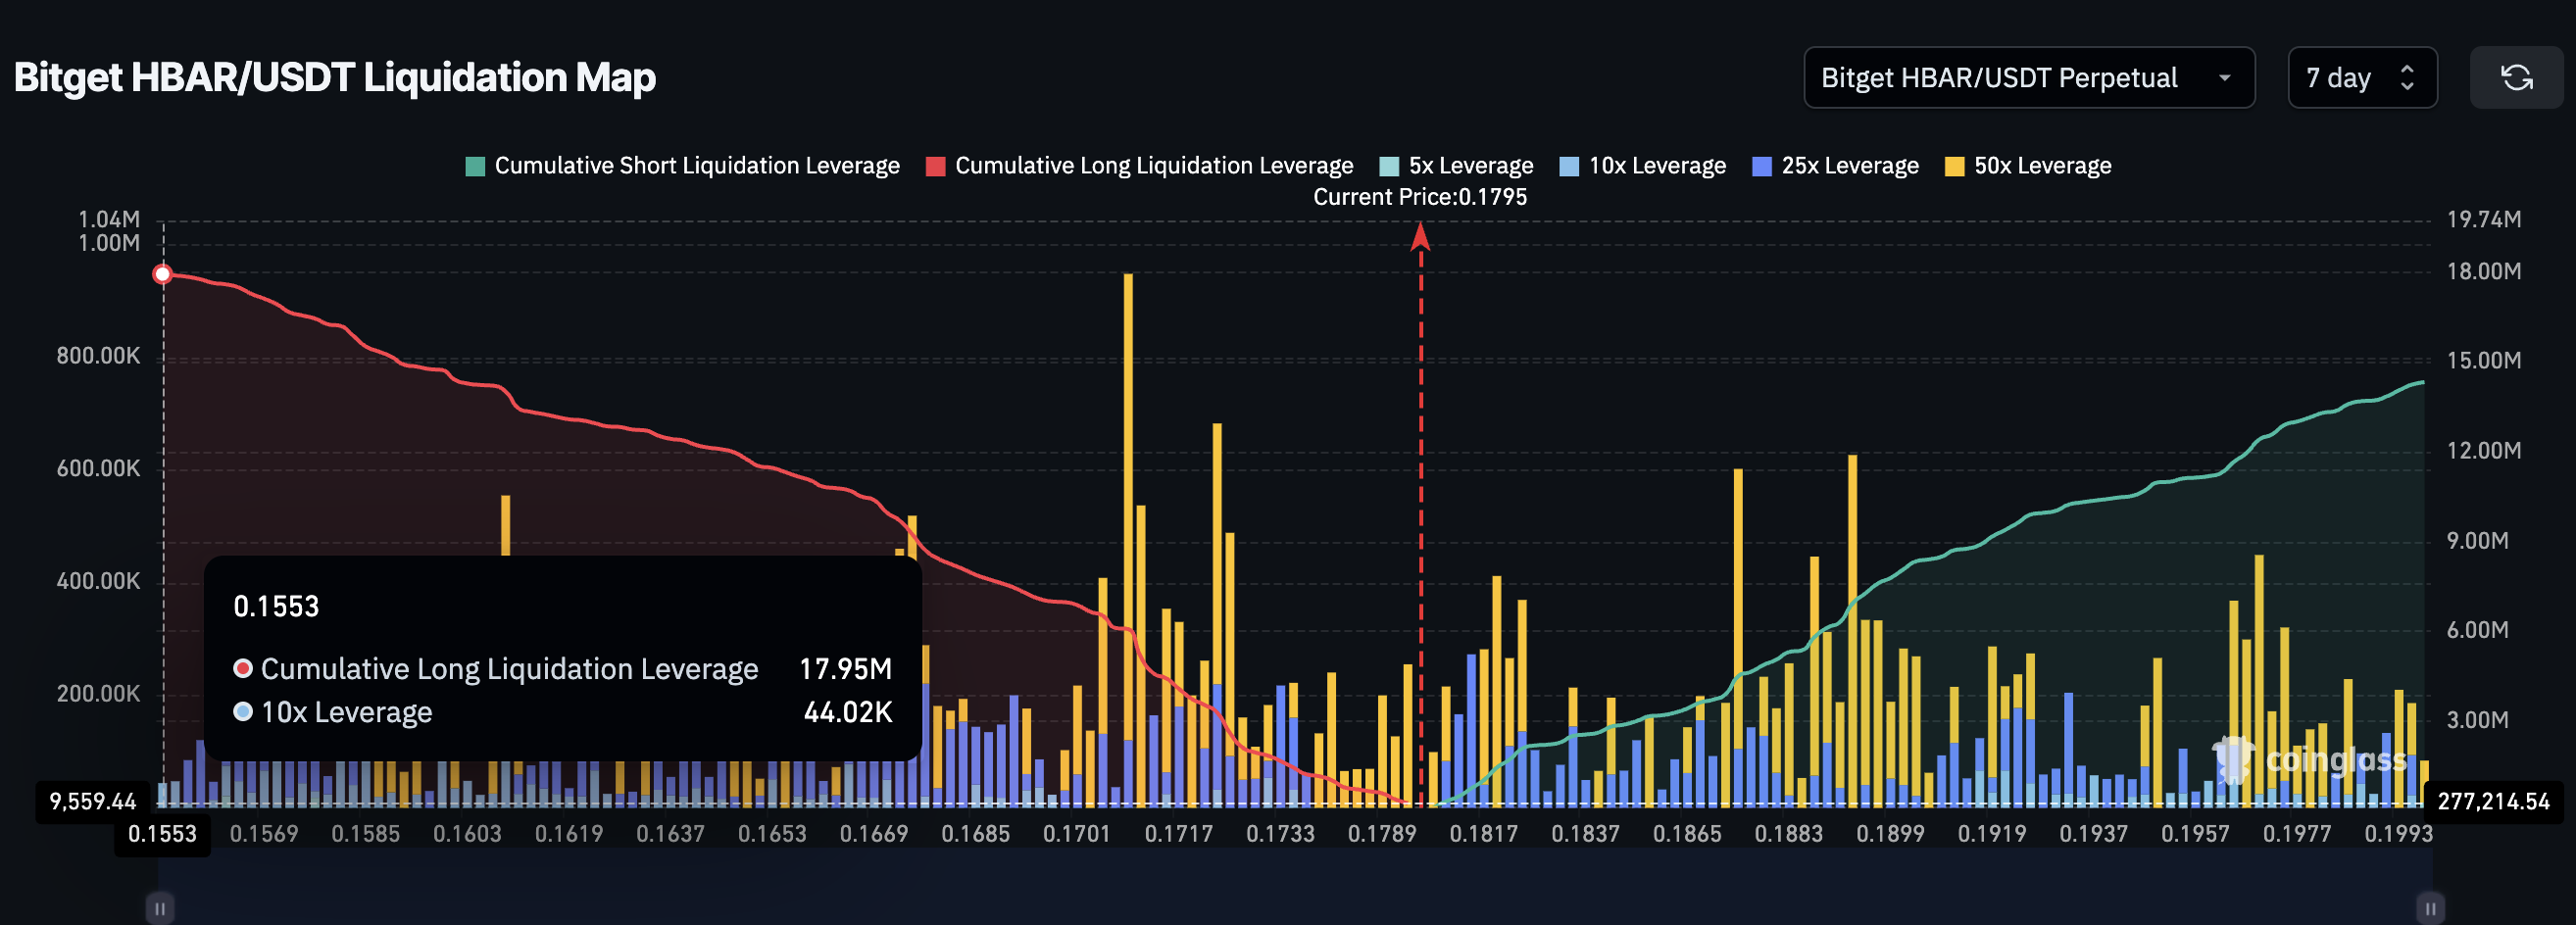 Long Squeeze Risk Exists:
Coinglass
Long Squeeze Risk Exists:
Coinglass
Longs outweigh shorts by almost 25%, which leaves the market exposed. If price reaches the neckline, led by weak OBV, a long squeeze could kick in, accelerating the downside.
Key Levels Now Decide Whether HBAR Price Drops or Escapes
HBAR now comes down to two paths:
Bearish path (likely if the neckline breaks): The neckline of the head-and-shoulders pattern sits near $0.160. A clean drop below it completes the structure and exposes a 28% fall, with the HBAR price chart pointing toward $0.113 and even $0.100 if long liquidations cascade.
Bullish path (only if reclaimed): A recovery starts only if HBAR reclaims $0.199 with strength. A full invalidation happens at $0.219, which erases the pattern and shifts momentum back to buyers.
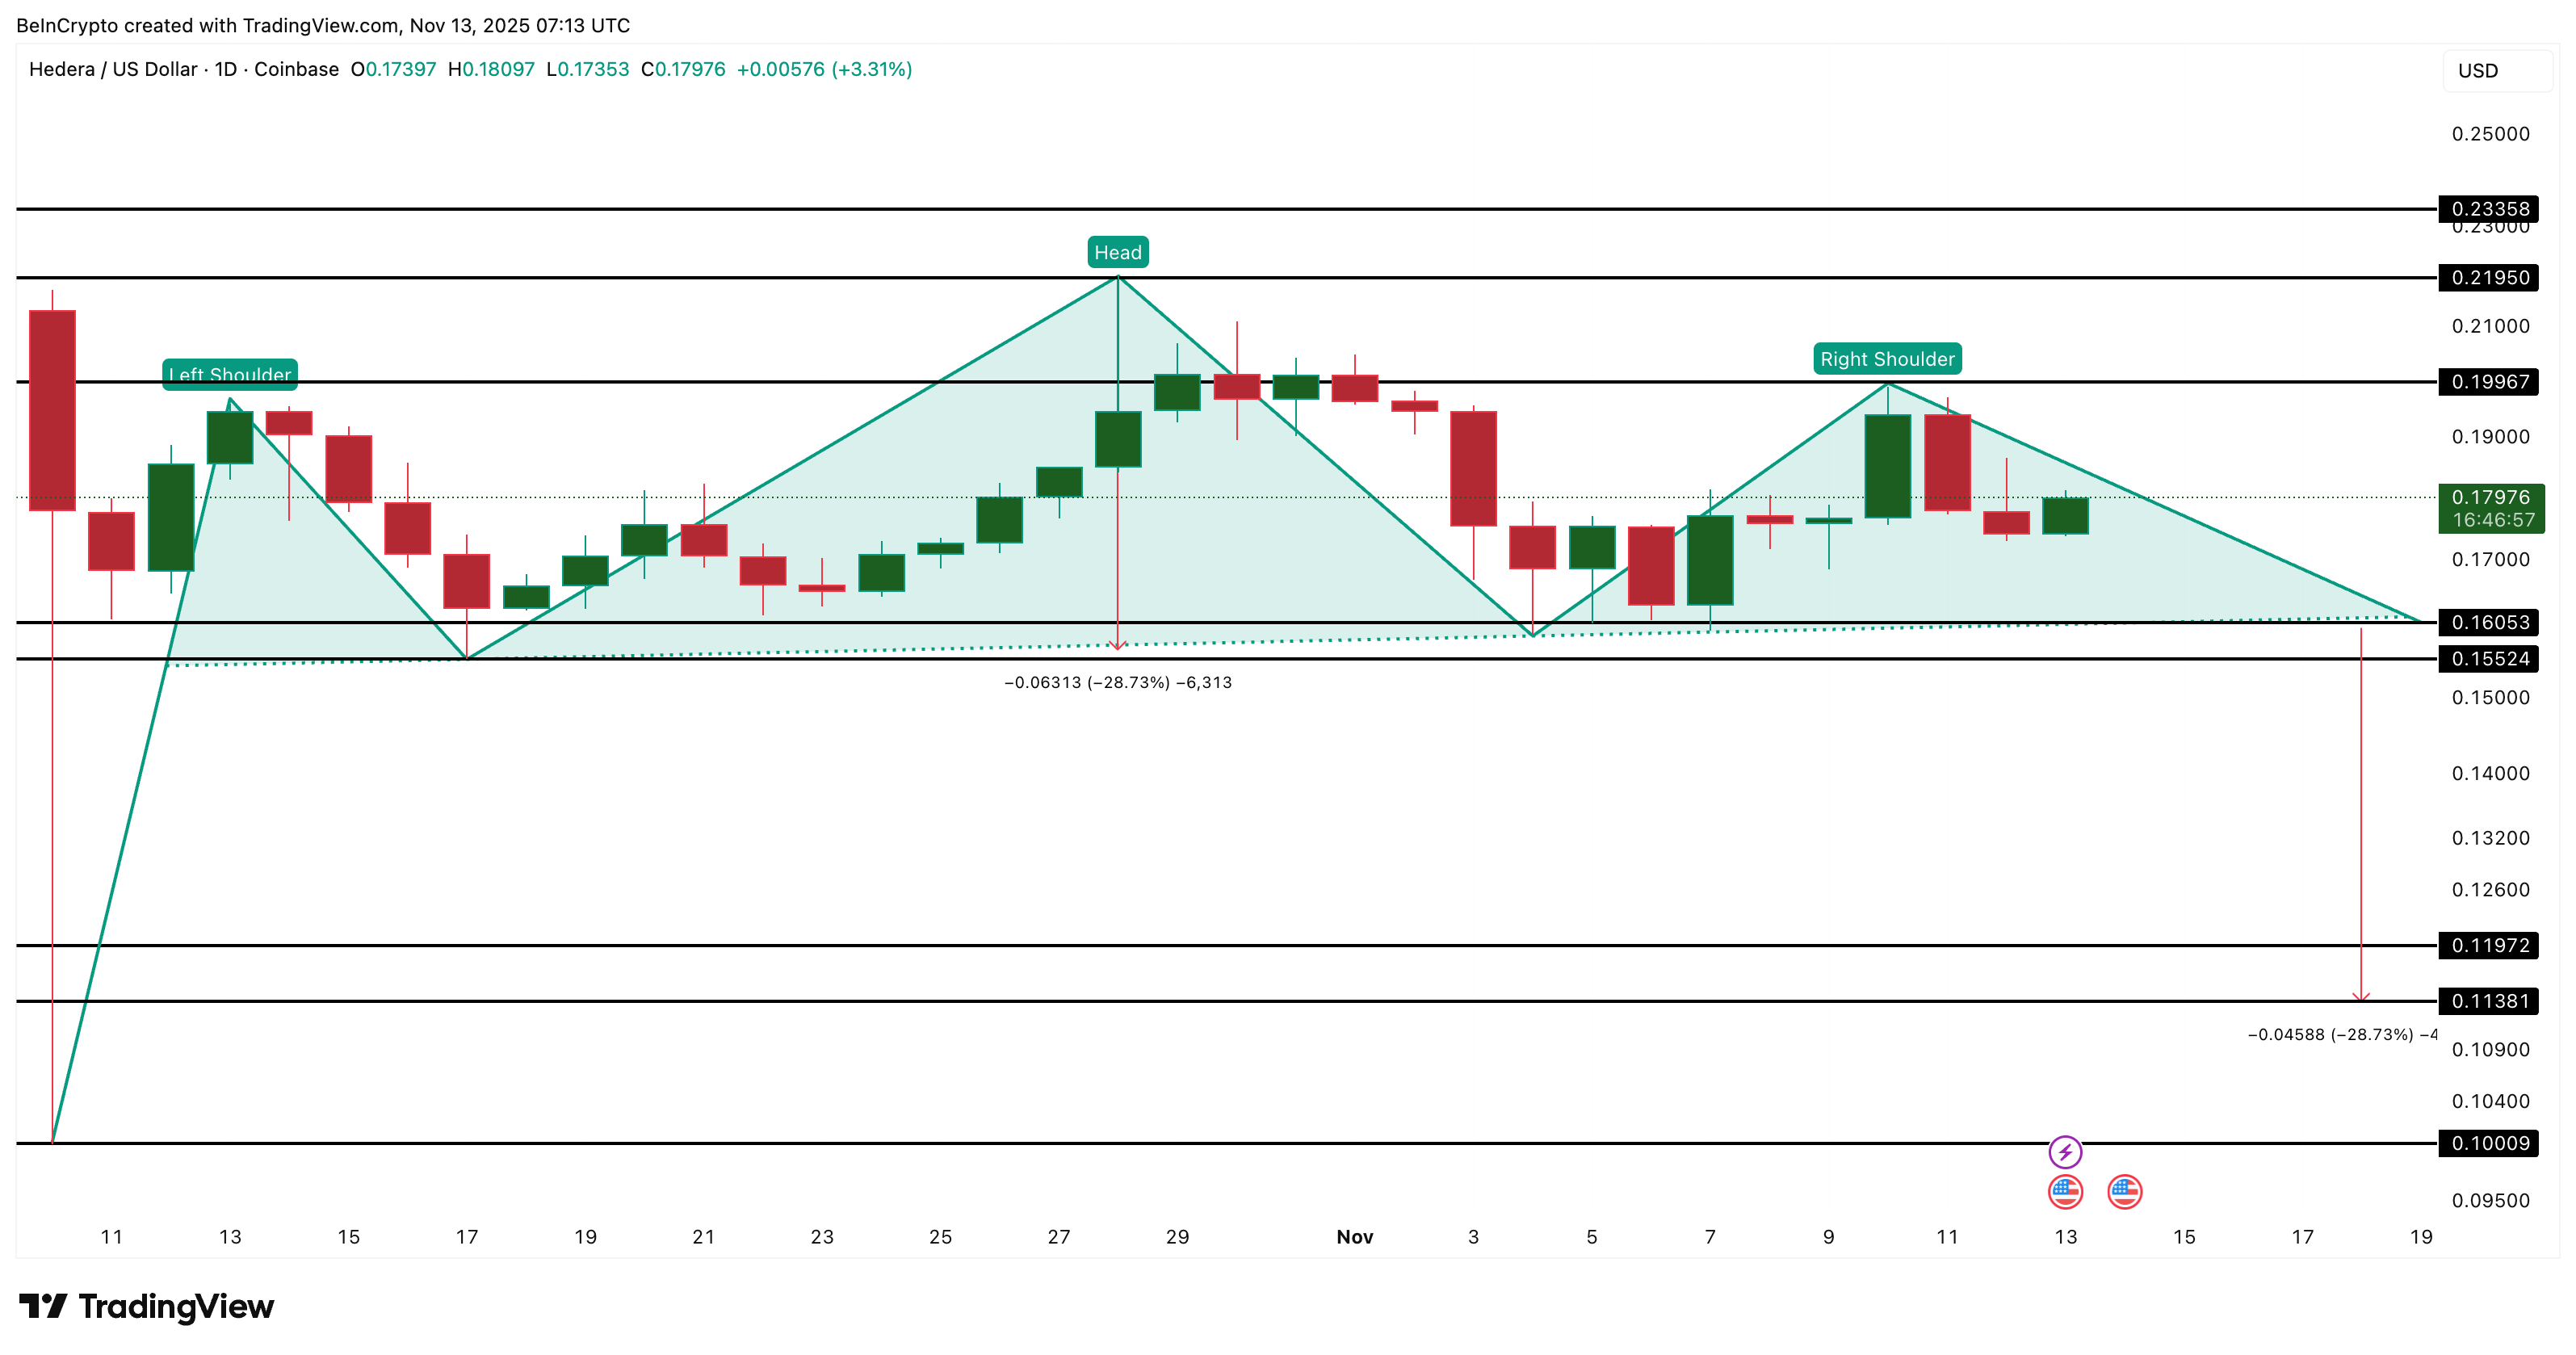 HBAR Price Analysis:
TradingView
HBAR Price Analysis:
TradingView
For any bullish scenario to hold, OBV must stay above its ascending trendline. If OBV fails, the neckline breaks faster — and the long squeeze risk increases sharply. For now, the HBAR price is heading toward a crash site, with one level ($0.160) still standing between the price and the fall.
Read the article at BeInCryptoDisclaimer: The content of this article solely reflects the author's opinion and does not represent the platform in any capacity. This article is not intended to serve as a reference for making investment decisions.
You may also like
ICP's $4.92 Level Key as Energy Industry Drives Sustained Positive Outlook
- ICP token consolidates below $4.97 after failed $5.17 breakout, with $4.92 support critical for avoiding deeper correction. - Energy sector gains momentum as Constellation Energy secures $1B loan for Three Mile Island nuclear restart to support AI data centers. - GDS Holdings reports 74.4% data center utilization, reflecting strong demand for hyperscale infrastructure linked to AI expansion. - Analysts highlight energy-sector tailwinds for ICP's long-term potential despite near-term technical uncertainty
XRP News Today: XRP's Death Cross and $2.20 Breach Indicate Broad Market Downturn
- XRP跌破关键$2.20支撑位并形成死亡交叉技术形态,短期看跌信号显著增强。 - 技术分析预测价格可能进一步下探$1.25,跌破历史支撑区间引发持续性担忧。 - 加密市场整体承压,比特币/以太坊同步出现死亡交叉,显示行业性熊市趋势。 - 支持者指出XRP跨境支付优势或吸引抄底资金,但短期流动性紧缩加剧下行风险。
Bitcoin News Update: Bitcoin's Recent Decline: Can Institutional Investors Help Steady the Market or Intensify the Slump?
- Bitcoin's price drop below $85,000 has intensified debates as long-term holders offload over 400,000 BTC, per economist Peter Schiff's warning about "weak hands" deepening selloffs. - High-profile exits like Owen Gunden's $1.3B BTC liquidation highlight profit-taking by OGs, while institutions via ETFs have absorbed 2.39M BTC since 2024, per Ark Invest. - Market fragility worsens as gamma exposure forces dealers to sell near $85,000 support, but institutional demand could stabilize prices if buying conti
YFI Value Drops 4.78% Over the Past Week as Market Fluctuations Continue
- YFI rose 0.1% in 24 hours but fell 4.78% in seven days, with 14.2% monthly and 50% annual declines. - Price movements reflect broader market instability, not project-specific updates or governance changes in Yearn.finance. - Analysts predict YFI remains sensitive to macroeconomic trends and global investor sentiment in the near term. - Token consolidation continues without fundamental shifts, urging investors to monitor on-chain metrics and protocol updates.
