HBAR Price Breakdown Was Expected — The Bear Trap Risk Was Not

The HBAR price broke below its neckline this week, completing the bearish pattern we highlighted earlier. Spot selling has jumped and shorts now dominate futures positioning, yet a hidden RSI divergence and crowded leverage suggest the breakdown may not be as straightforward as it looks. If key levels are reclaimed, the setup could flip into a bear trap instead of a continuation move.
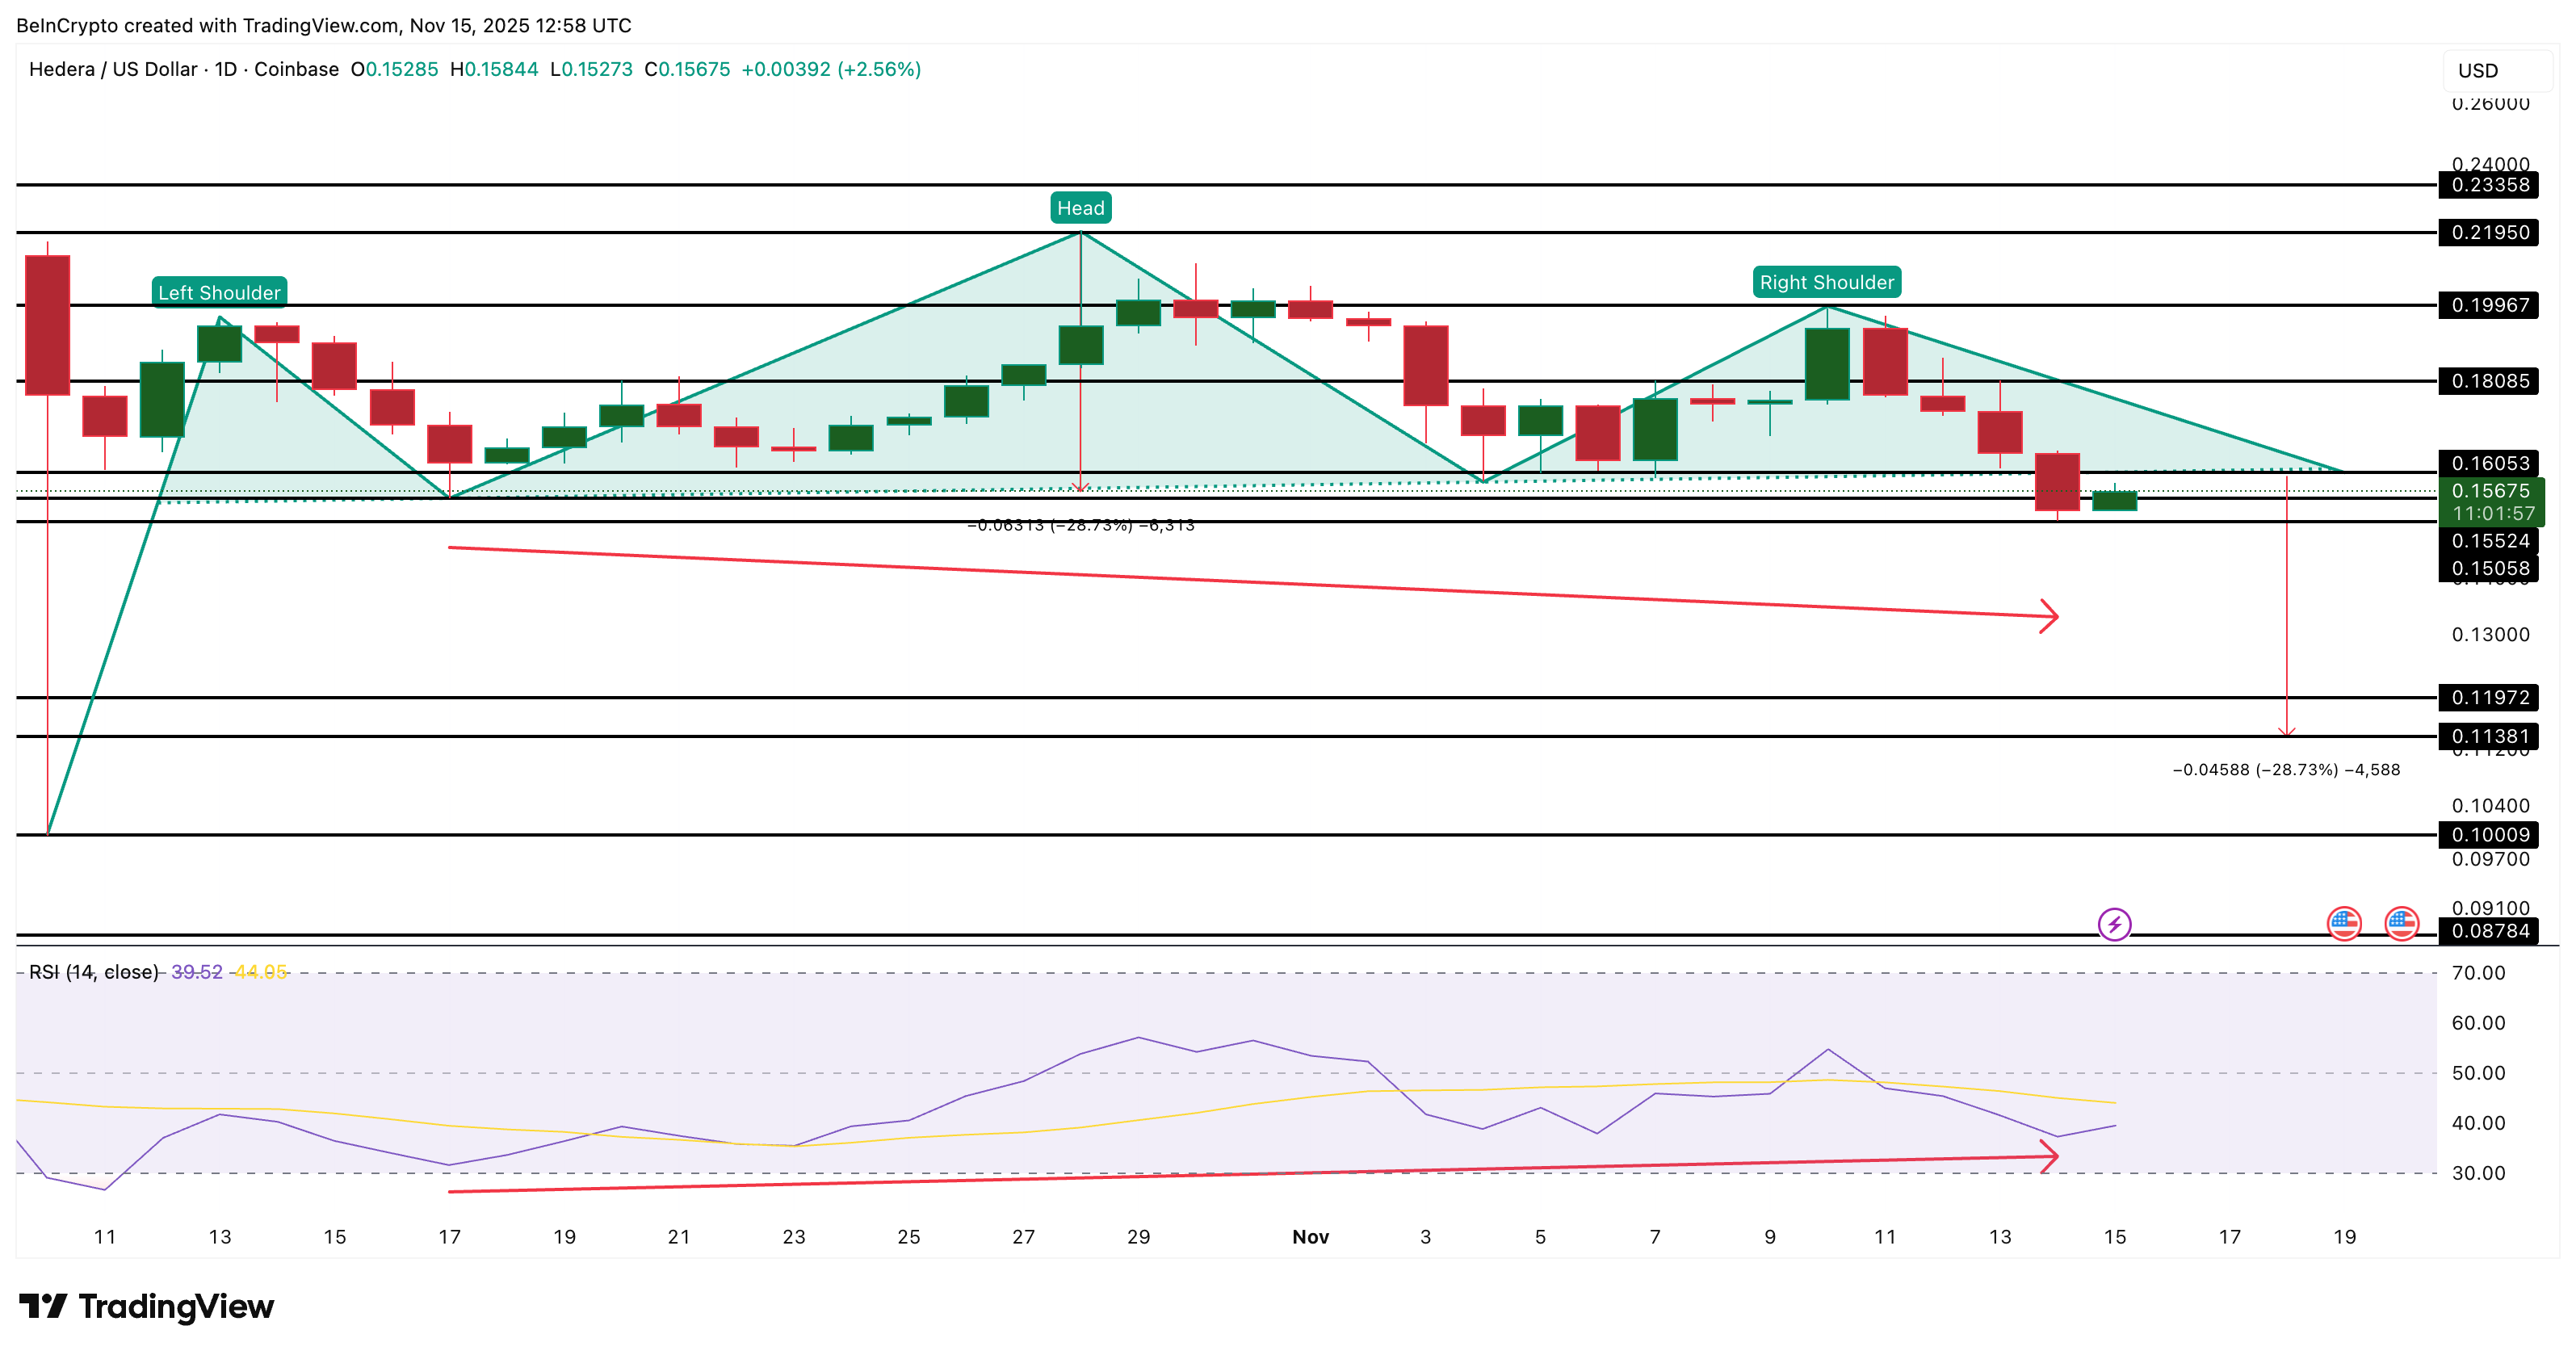
HBAR is down almost 11% in the past week, and yesterday it finally broke below its neckline, completing the head and shoulders pattern we projected on November 13. Despite the breakdown, the last 24 hours have been surprisingly flat.
And while the structure still points toward lower levels, early signs suggest that traders betting on deeper downside may be walking into a bear trap instead. Here is why.
Selling Rises and Shorts Pile Up — But The Setup Isn’t That Simple
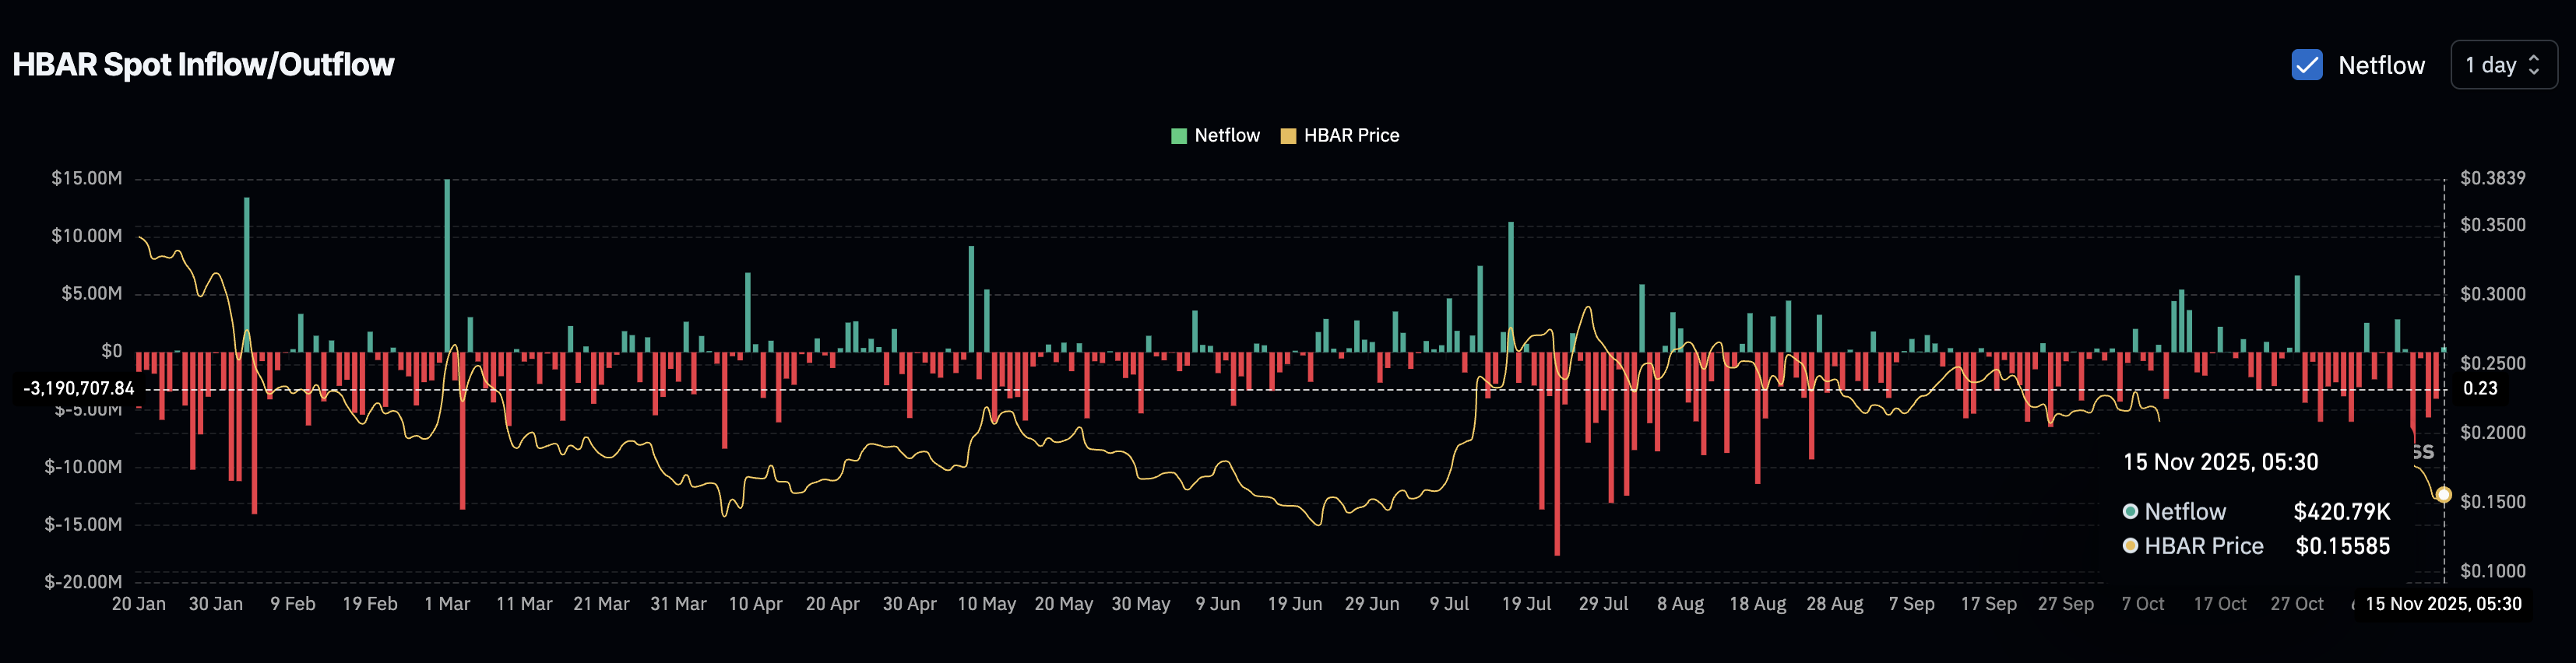
HBAR’s spot flows show a sharp shift in behaviour after the breakdown. On November 14, HBAR recorded –4.03 million in net outflows, meaning more tokens were leaving exchanges as buyers accumulated.
Today, after the pattern breakdown confirmed, flows flipped to +420,790 HBAR.
 Sellers Are Back Post Breakdown:
That is a 110% swing from negative to positive netflow — a clear sign that sellers have stepped in aggressively after the pattern break.
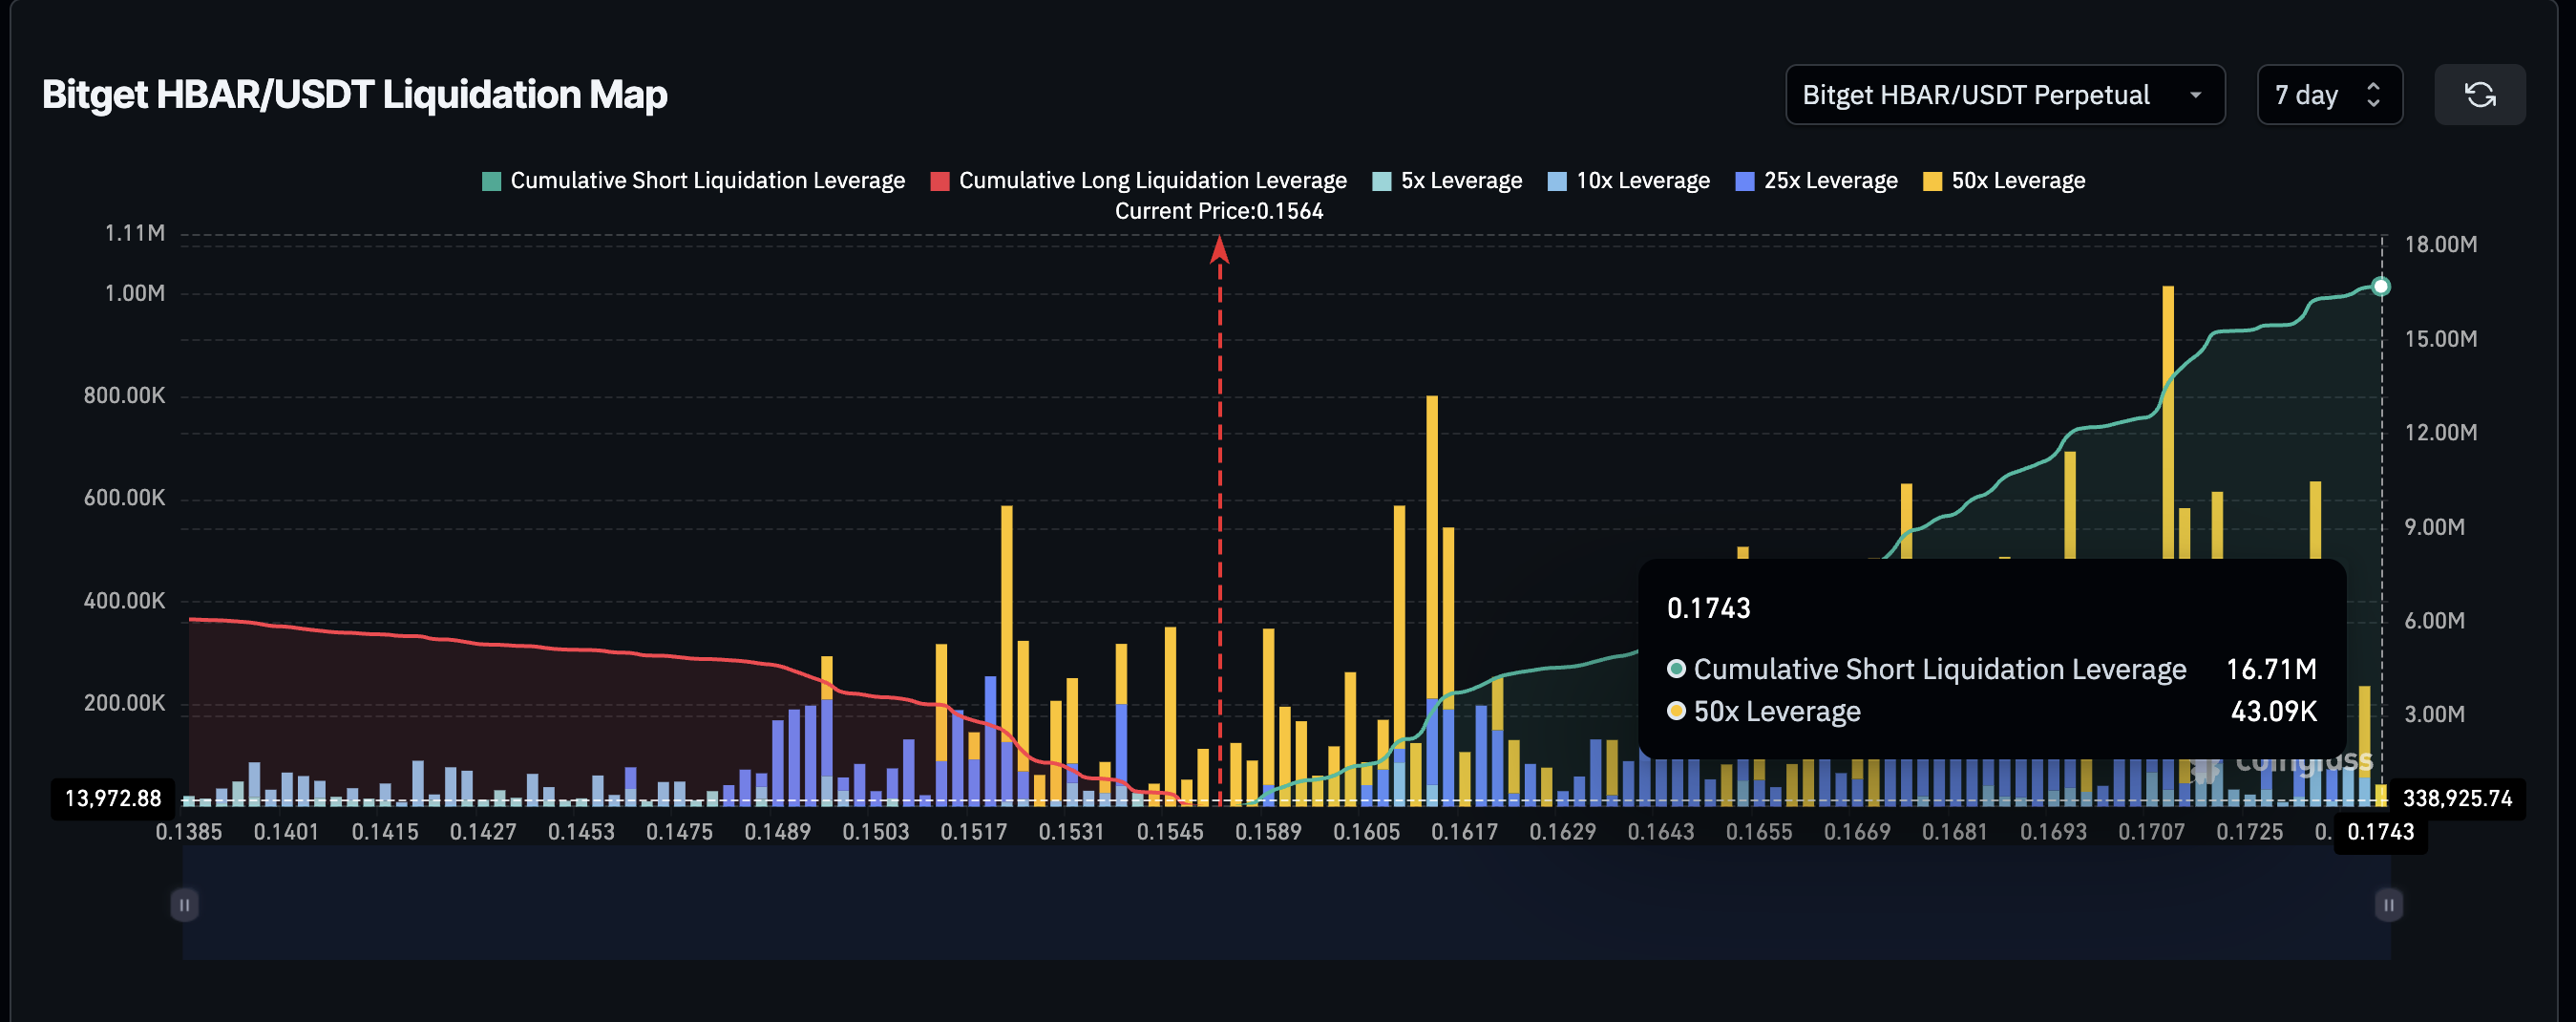
The derivatives market shows an even stronger tilt. On Bitget’s liquidation map alone, short exposure is $16.71 million, while long exposure is $6.09 million. This means shorts now control 73% of all leveraged positions — about 2.7 times more than longs.
 HBAR Shorts Dominate The Map:
This kind of crowded positioning often fuels the conditions for a bear trap risk, where price briefly reverses upward and forces shorts to close their positions at a loss.
The HBAR price breakdown has occurred, yes — but this positioning makes it dangerous to assume the move will continue uninterrupted.
One Move Could Drive HBAR Price Rebound, Hitting Short Liquidations
The price chart contains the key reason a bear trap is possible. While HBAR broke below the neckline, the follow-through has been weak. At the same time, the Relative Strength Index (RSI) — a metric that measures price momentum to show if an asset is oversold or overbought — is showing a notable pattern.
Between October 17 and November 14, the price made a lower low, while RSI formed a higher low. This is a bullish RSI divergence, and it often appears just before a short-term reversal attempt.
If the divergence plays out, the first trigger is a move back above $0.160, which is exactly where the neckline sits. Reclaiming this level puts a large block of short positions at risk.
The liquidation map shows that shorts begin getting squeezed as the price rises above this zone.
 HBAR Price Analysis:
A push above $0.180 would confirm the trap is fully in place and force even deeper short liquidations, giving HBAR room for a stronger rebound. However, the trap only works if buyers hold key support levels.
If HBAR drops below $0.155, the divergence weakens and the downtrend regains control. In that case, the head and shoulders projection remains valid, opening the way toward the earlier bearish target near $0.113.
Disclaimer: The content of this article solely reflects the author's opinion and does not represent the platform in any capacity. This article is not intended to serve as a reference for making investment decisions.
You may also like
Bitcoin News Update: CFTC's Broader Role in Crypto Regulation Ignites Discussion on Clearer Rules
- U.S. lawmakers propose expanding CFTC's crypto oversight via a bill reclassifying spot trading, diverging from SEC's enforcement approach. - Harvard University invests $443M in BlackRock's IBIT ETF, reflecting institutional confidence in crypto as a legitimate asset class. - DeFi projects like Mutuum Finance raise $18.7M in presales, leveraging regulatory momentum and transparent on-chain credit systems. - RockToken's infrastructure-backed crypto contracts attract long-term investors with structured yiel

DASH Aster DEX's Latest On-Chain Growth and What It Means for DeFi Liquidity
- DASH Aster DEX leads 2025 DeFi shift with hybrid AMM-CEX model and multi-chain support (BNB, Ethereum , Solana), boosting TVL to $1.399B and Q3 daily trading volumes of $27.7B. - Platform's 1,650% ASTER token price surge post-TGE attracted 330,000 new wallets, with 94% of BSC-USD volume ($2B/day) driving institutional adoption via Binance/YZi partnerships. - ASTER token mechanics enable 80% margin trading, 5-7% staking rewards, and governance rights, while annual 5-7% fee burns create scarcity and align

Astar 2.0: Leading a New Generation of DeFi and Cross-Chain Advancements
- Astar 2.0 introduces a zkEVM mainnet and cross-chain interoperability, slashing gas fees and enabling 150,000 TPS with 2025 scalability goals. - Strategic partnerships with Mazda, Japan Airlines, and Sony demonstrate blockchain's real-world applications in logistics, loyalty programs, and digital asset tokenization. - Q3 2025 data shows $2.38M DeFi TVL growth and 20% active wallet increase, alongside a $3.16M institutional ASTR token acquisition. - The platform aims to solidify its role as a foundational
Aster DEX Introduces New On-Ramp: Transforming Retail Participation in DeFi
- Aster DEX integrates institutional-grade custody and privacy tech (zero-knowledge proofs) to bridge retail-institutional DeFi gaps via BNB Chain partnerships. - TVL surged to $2.18B by late 2025 through yield-bearing stablecoins and hidden orders, attracting both retail and institutional liquidity. - Despite compliance gaps and wash trading concerns, Aster's Binance alignment and Coinbase listing signals growing institutional validation.