Date: Tue, Nov 18, 2025 | 10:25 AM GMT
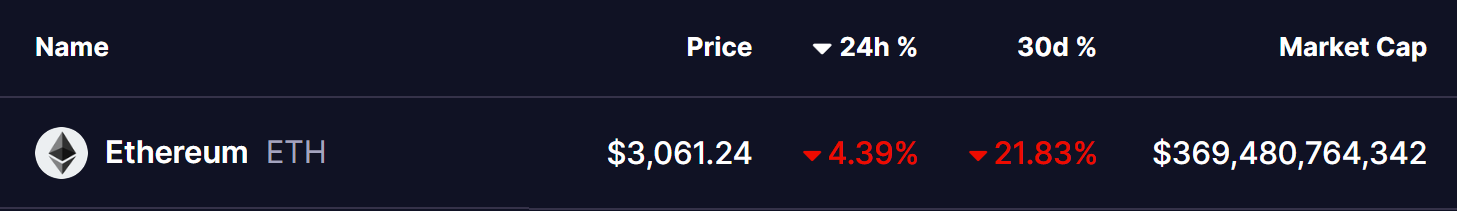
The cryptocurrency market continues to swing sharply, shedding 3.62% from total market cap in the last 24 hours. Both Bitcoin (BTC) and Ethereum (ETH) have taken heavy hits, contributing to more than $1.03 billion in total liquidations — with a staggering $725 million wiped from long positions alone.
ETH is down over 4% today, but beneath the short-term volatility, something far more interesting is forming on the chart: a fractal setup that previously triggered a major reversal in April 2025.
 Source: Coinmarketcap
Fractal Setup Hints at a Reversal
On the daily timeframe, Ethereum’s price action seems to be repeating a familiar structure.
Back in late 2024, ETH formed a clear upside leg from point 0 → 1, followed by a corrective decline compressed inside a falling wedge. That correction extended all the way into the 2.0 Fibonacci extension, which acted as a strong support zone. From that level, ETH bounced sharply, broke out of the wedge, and staged a significant bullish reversal.
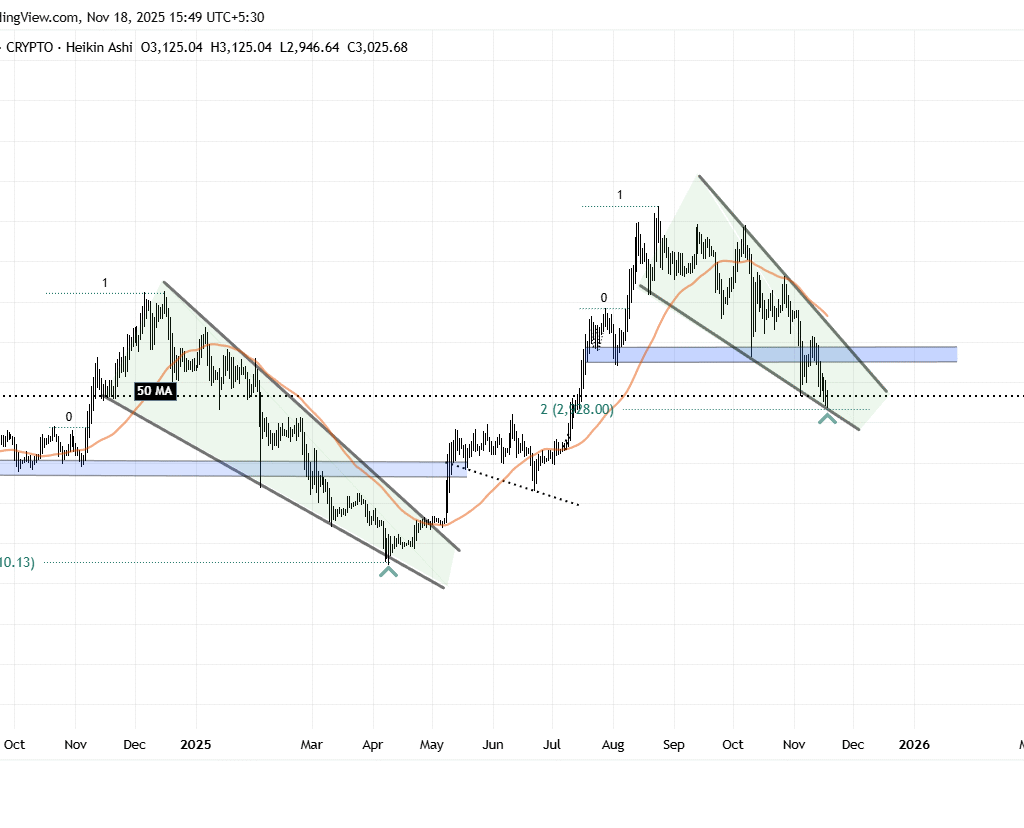 Ethereum (ETH) Daily Chart/Coinsprobe (Source: Tradingview)
Now, ETH appears to be following the same roadmap.
Once again, the price has completed a 0 → 1 upside leg and has since fallen into another falling wedge. This latest correction has driven ETH directly into the 2.0 Fib extension region, which sits around $2,930 — the same structural support area that fueled the previous reversal. ETH is beginning to show early signs of resilience here, hinting that buyers may be defending the zone just as before.
What’s Next for ETH?
If the fractal continues to repeat, the 2.0 Fibonacci level could act as a launchpad for a rebound. A strong reaction from this zone — followed by a breakout above the wedge and a reclaim of the 50-day moving average — would signal a shift in momentum back to the upside, closely mirroring the late-2024 recovery.
However, if ETH fails to hold the $2,930 support, the fractal becomes invalid. In that case, the price could trend lower toward the $2,600 region before finding its next potential base.