Pi Coin Price Still In Green, Yet The Chart Now Shows 3 Red Flags — Pullback Soon?

Pi Coin price is still green on the monthly chart, but the short-term structure has shifted. A bearish engulfing pattern, weakening OBV, and a hidden bearish divergence now hint that the recent bounce may be losing strength. Unless PI reclaims key resistance soon, a deeper pullback zone could open up.
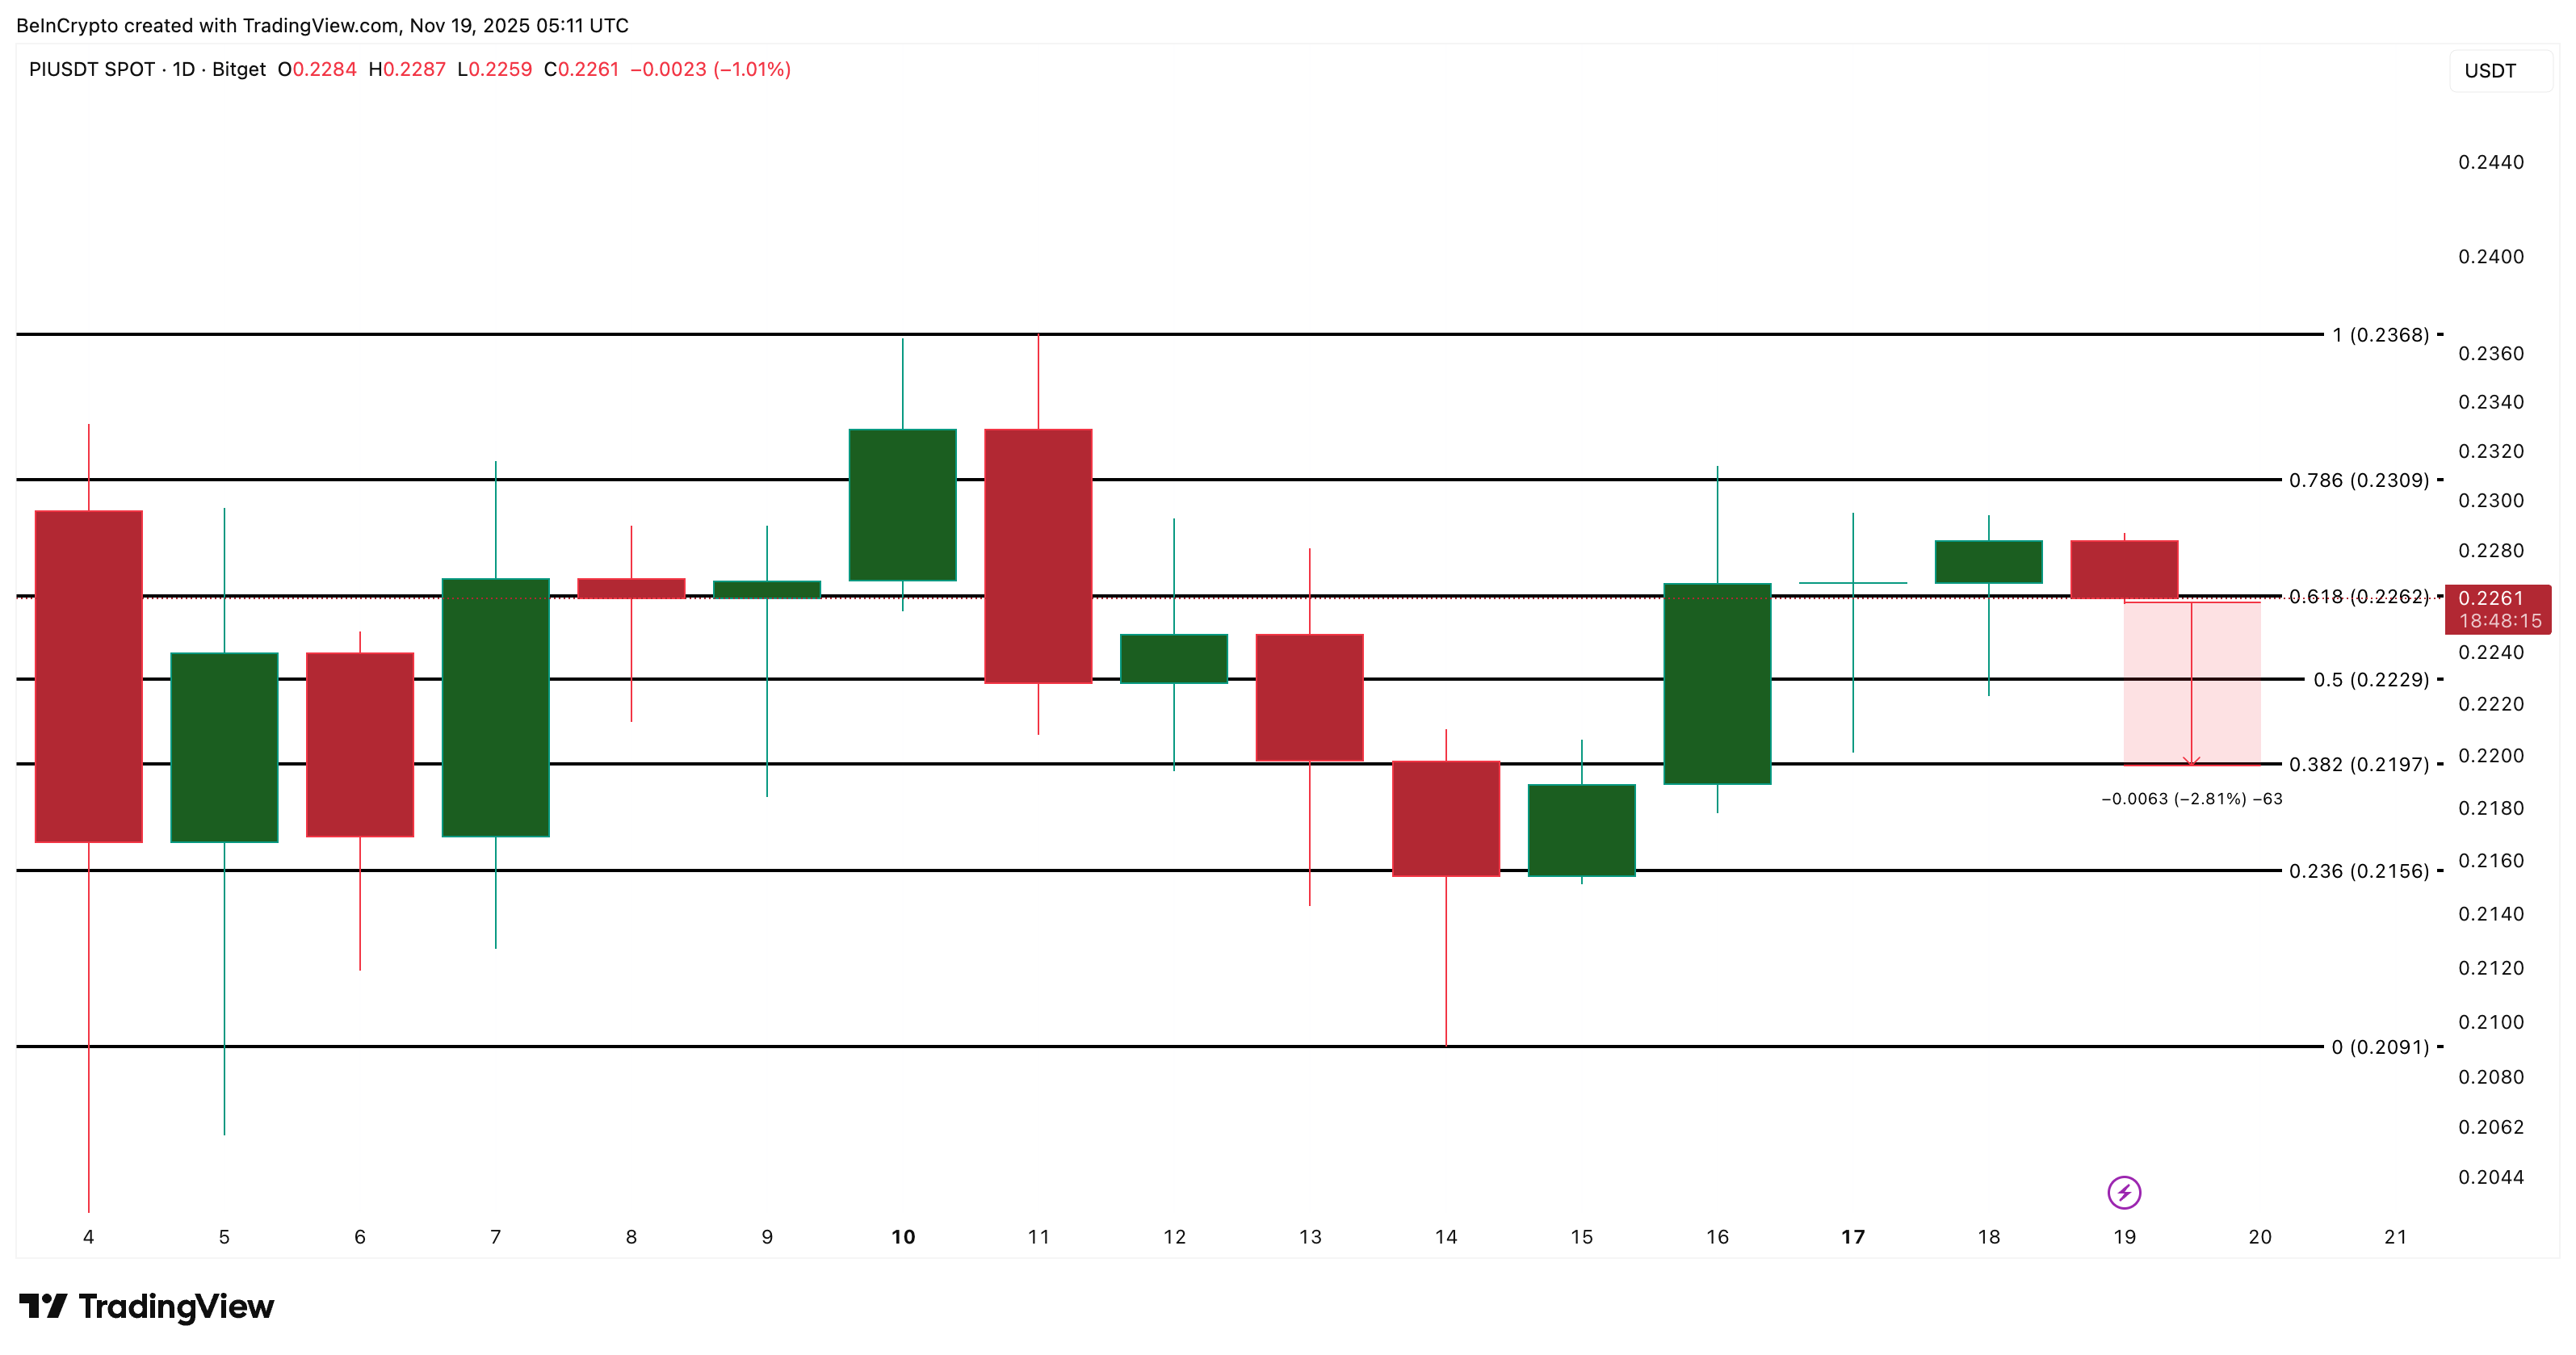
Pi Coin price is still up about 9% over the past month, but the short-term picture has started to soften. PI trades near $0.226 today, almost flat over the past 24 hours. Traders may see this as stability, but the charts are flashing several signs that the rebound from $0.209 may be running out of steam.
These early signals suggest a pullback could come unless buyers regain control.
Chart Signals Hint At A Weakening Bounce
The first sign comes from a bearish engulfing pattern that formed on the daily Pi Coin chart. A bearish engulfing appears when a red candle fully covers the previous green candle. It often shows that sellers have regained control after buyers lose momentum.
Each time this pattern has appeared on Pi Coin since October 21, the price has dropped sharply, sometimes by 8% and sometimes by as much as 20%.
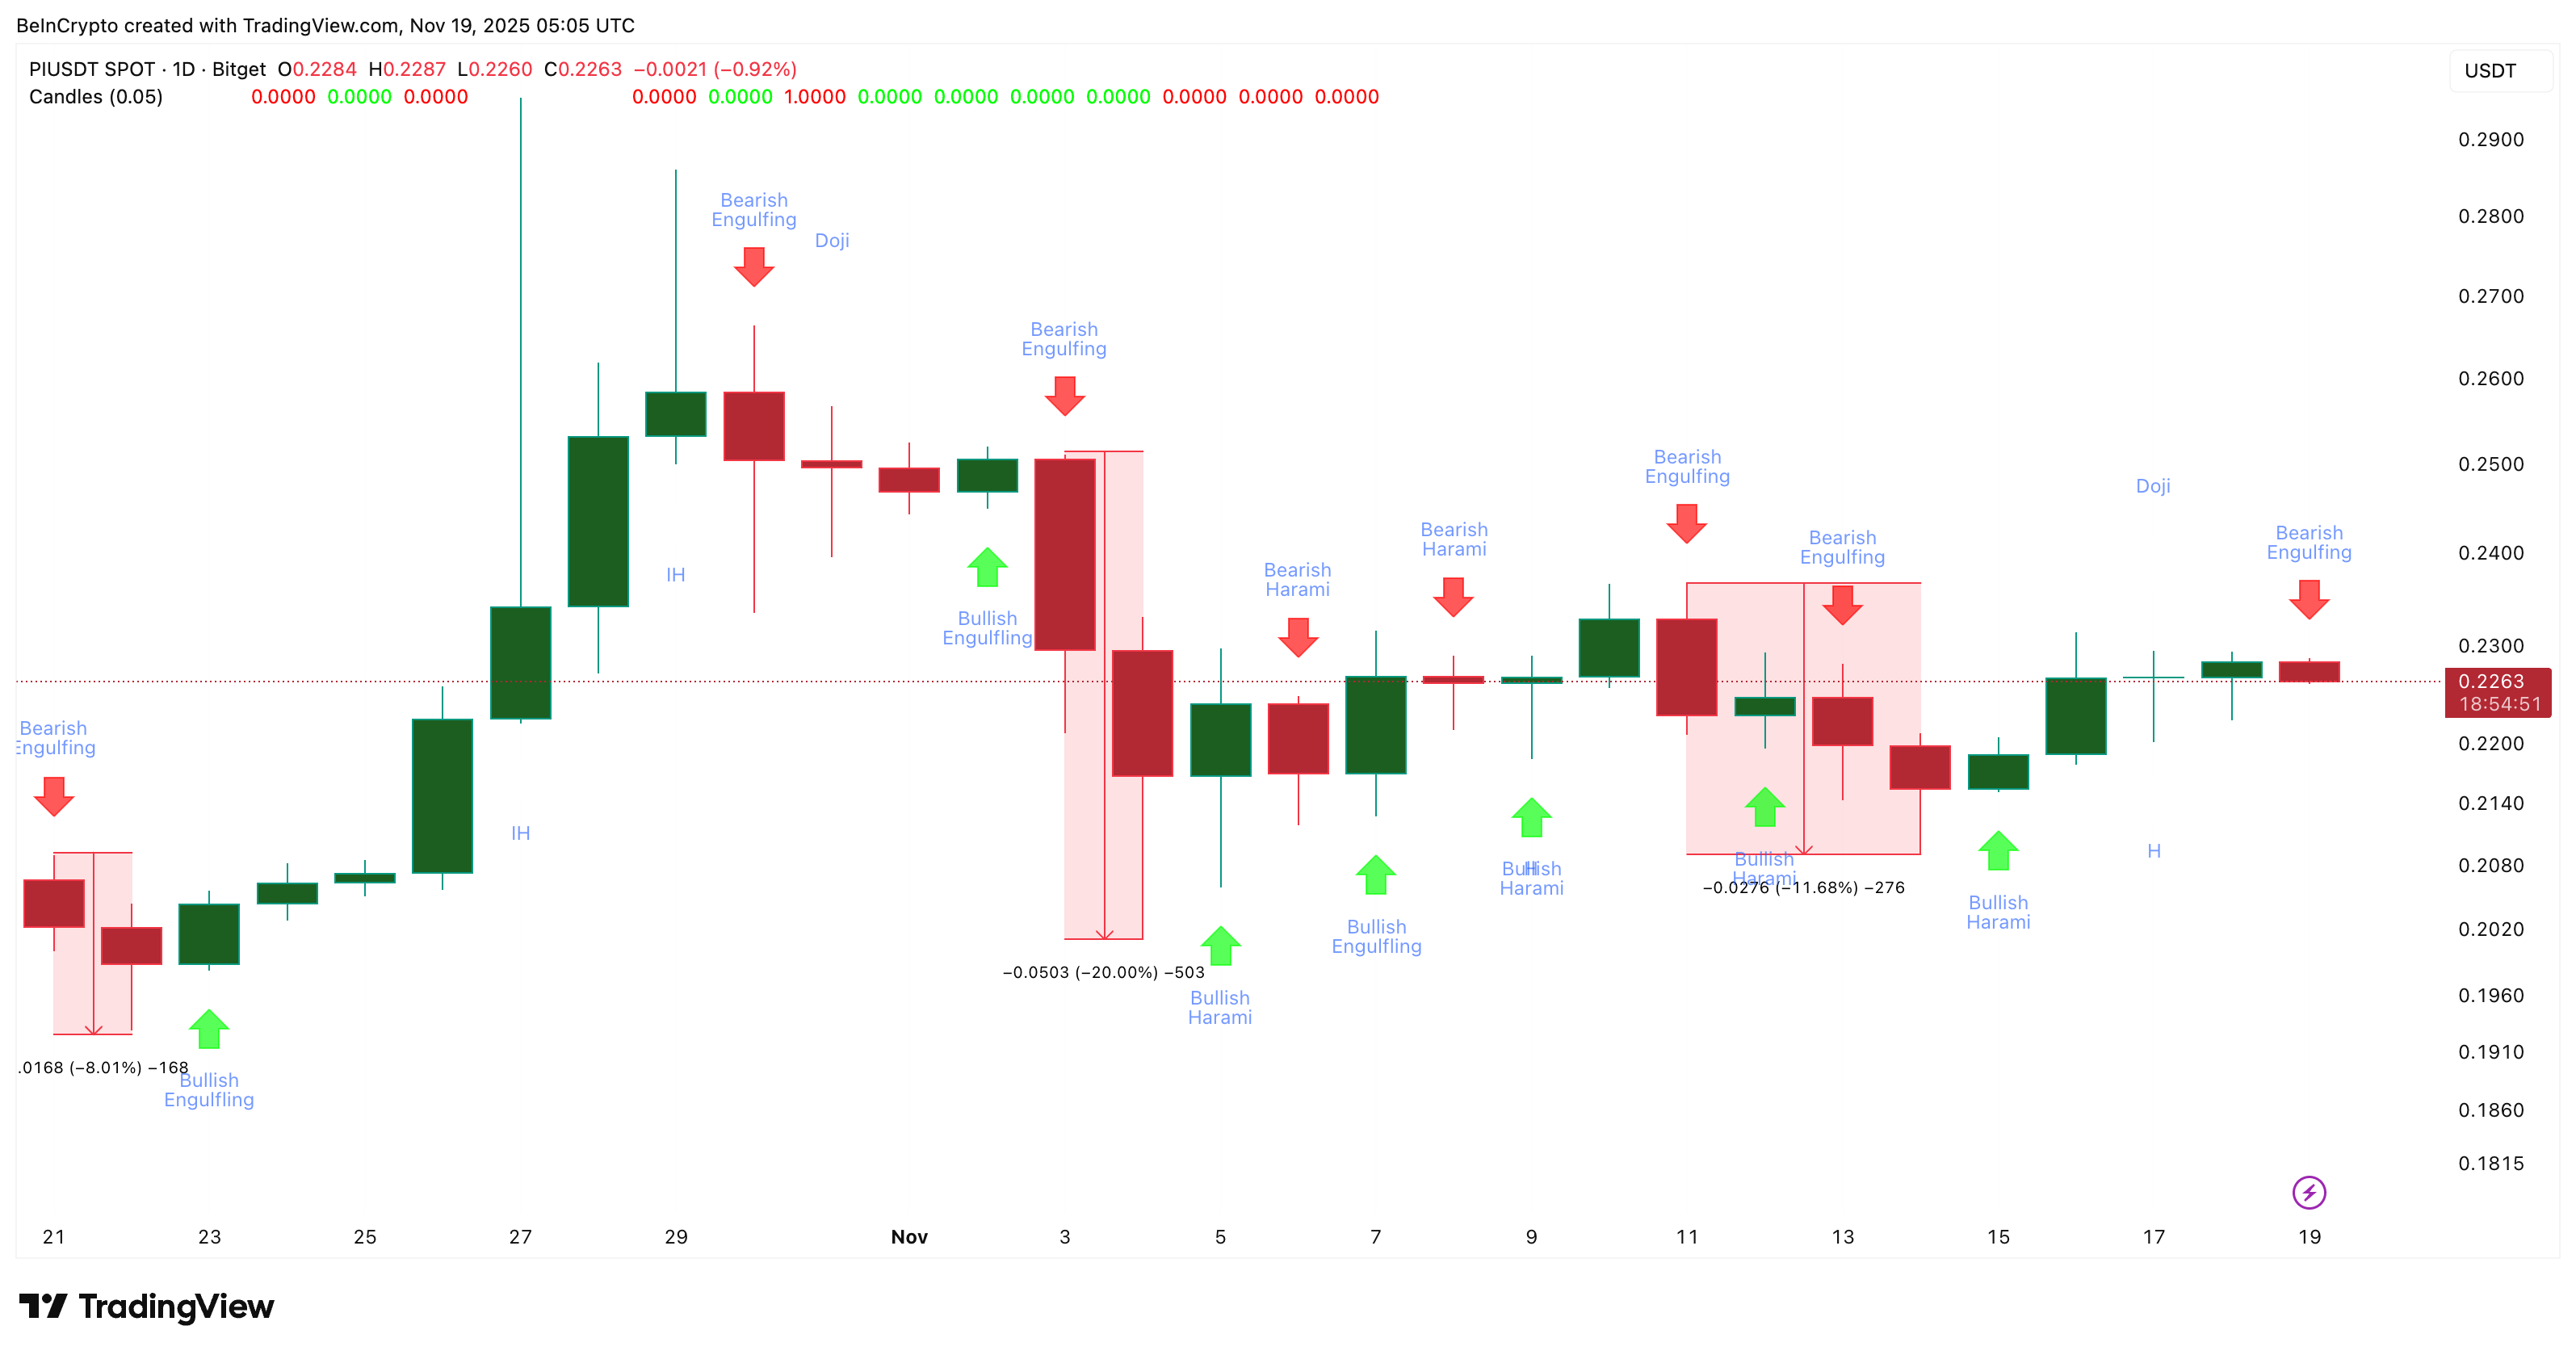 Key Candlestick Patterns:
TradingView
Key Candlestick Patterns:
TradingView
Want more token insights like this? Sign up for Editor Harsh Notariya’s Daily Crypto Newsletter.
The second sign comes from the on-balance volume (OBV) indicator. OBV helps show whether real money is flowing into or out of a token.
Between November 14 and 18, OBV made higher lows while the price also made higher lows. That showed real buying support during the bounce. But OBV has now broken below the rising trend line that has supported it for days. If OBV falls under –1.36 billion, it will confirm a lower low on volume, which is already sell-biased. That shift usually happens when buyers lose strength and sellers take over, completely.
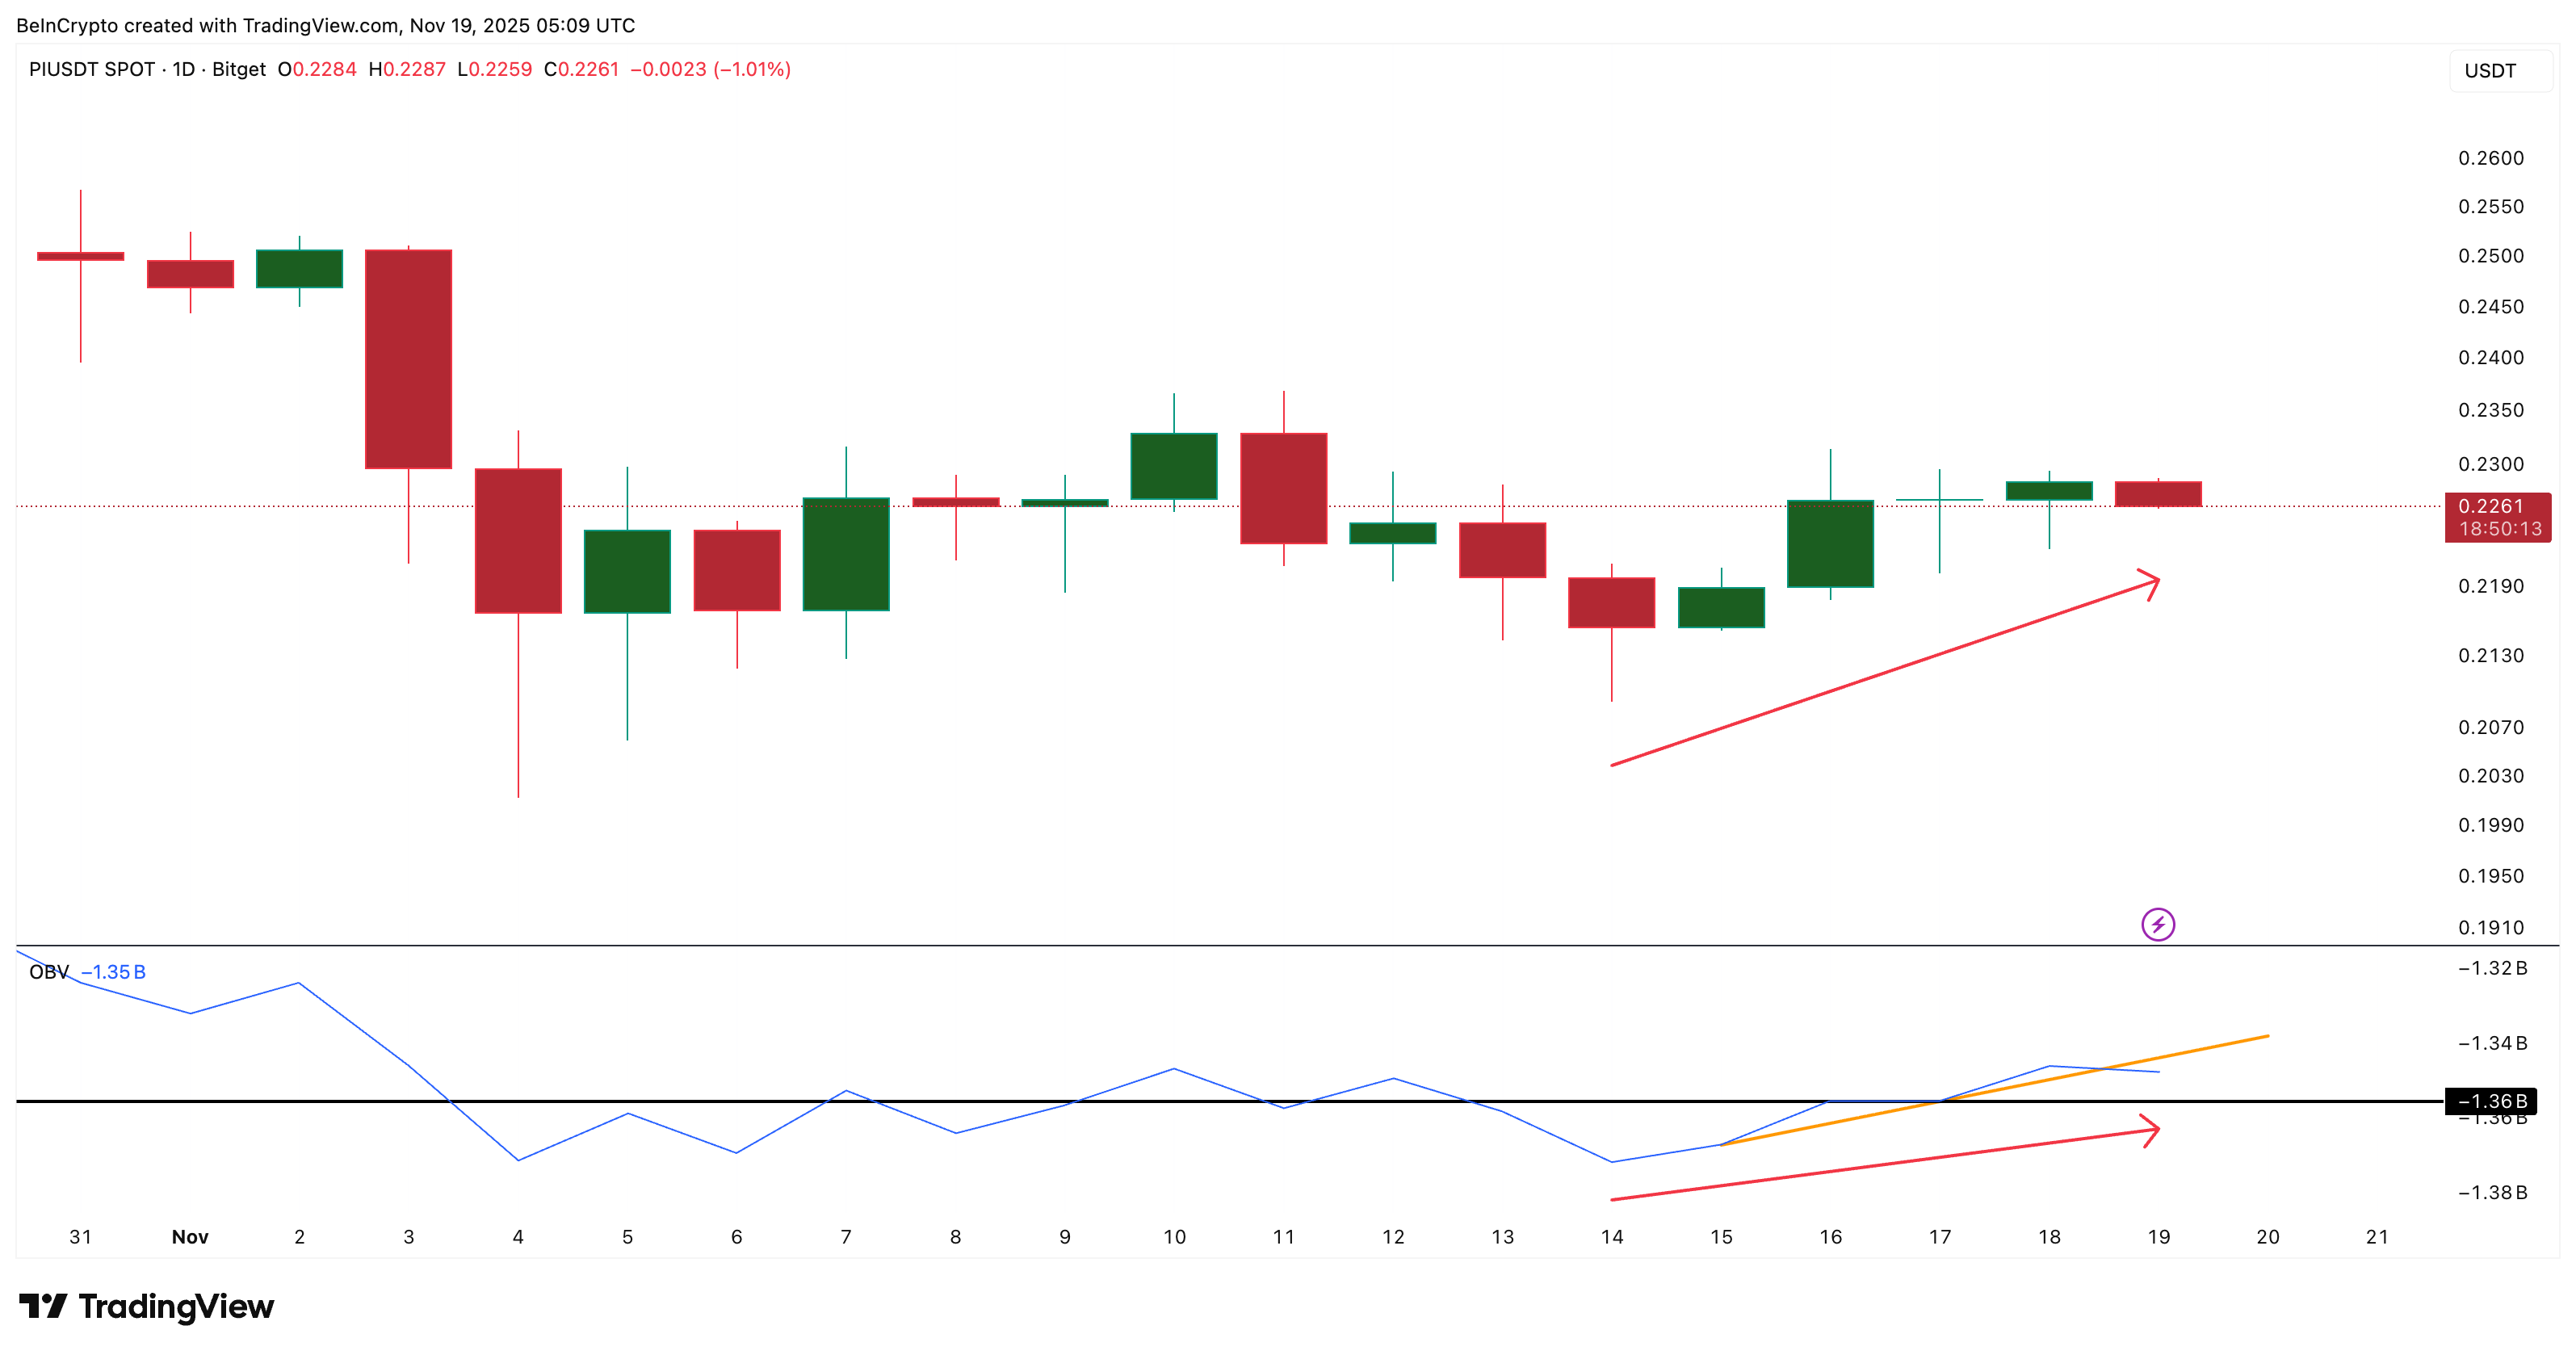 Pi Coin Volume Takes A Hit:
TradingView
Pi Coin Volume Takes A Hit:
TradingView
The third sign is a hidden bearish divergence on the Relative Strength Index (RSI). RSI measures buying strength.
Between November 16 and 18, the price made a lower high while the RSI made a higher high. This pattern is called hidden bearish divergence. It signals that the broader downtrend may still be in control and usually appears just before the next leg down in an ongoing downtrend.
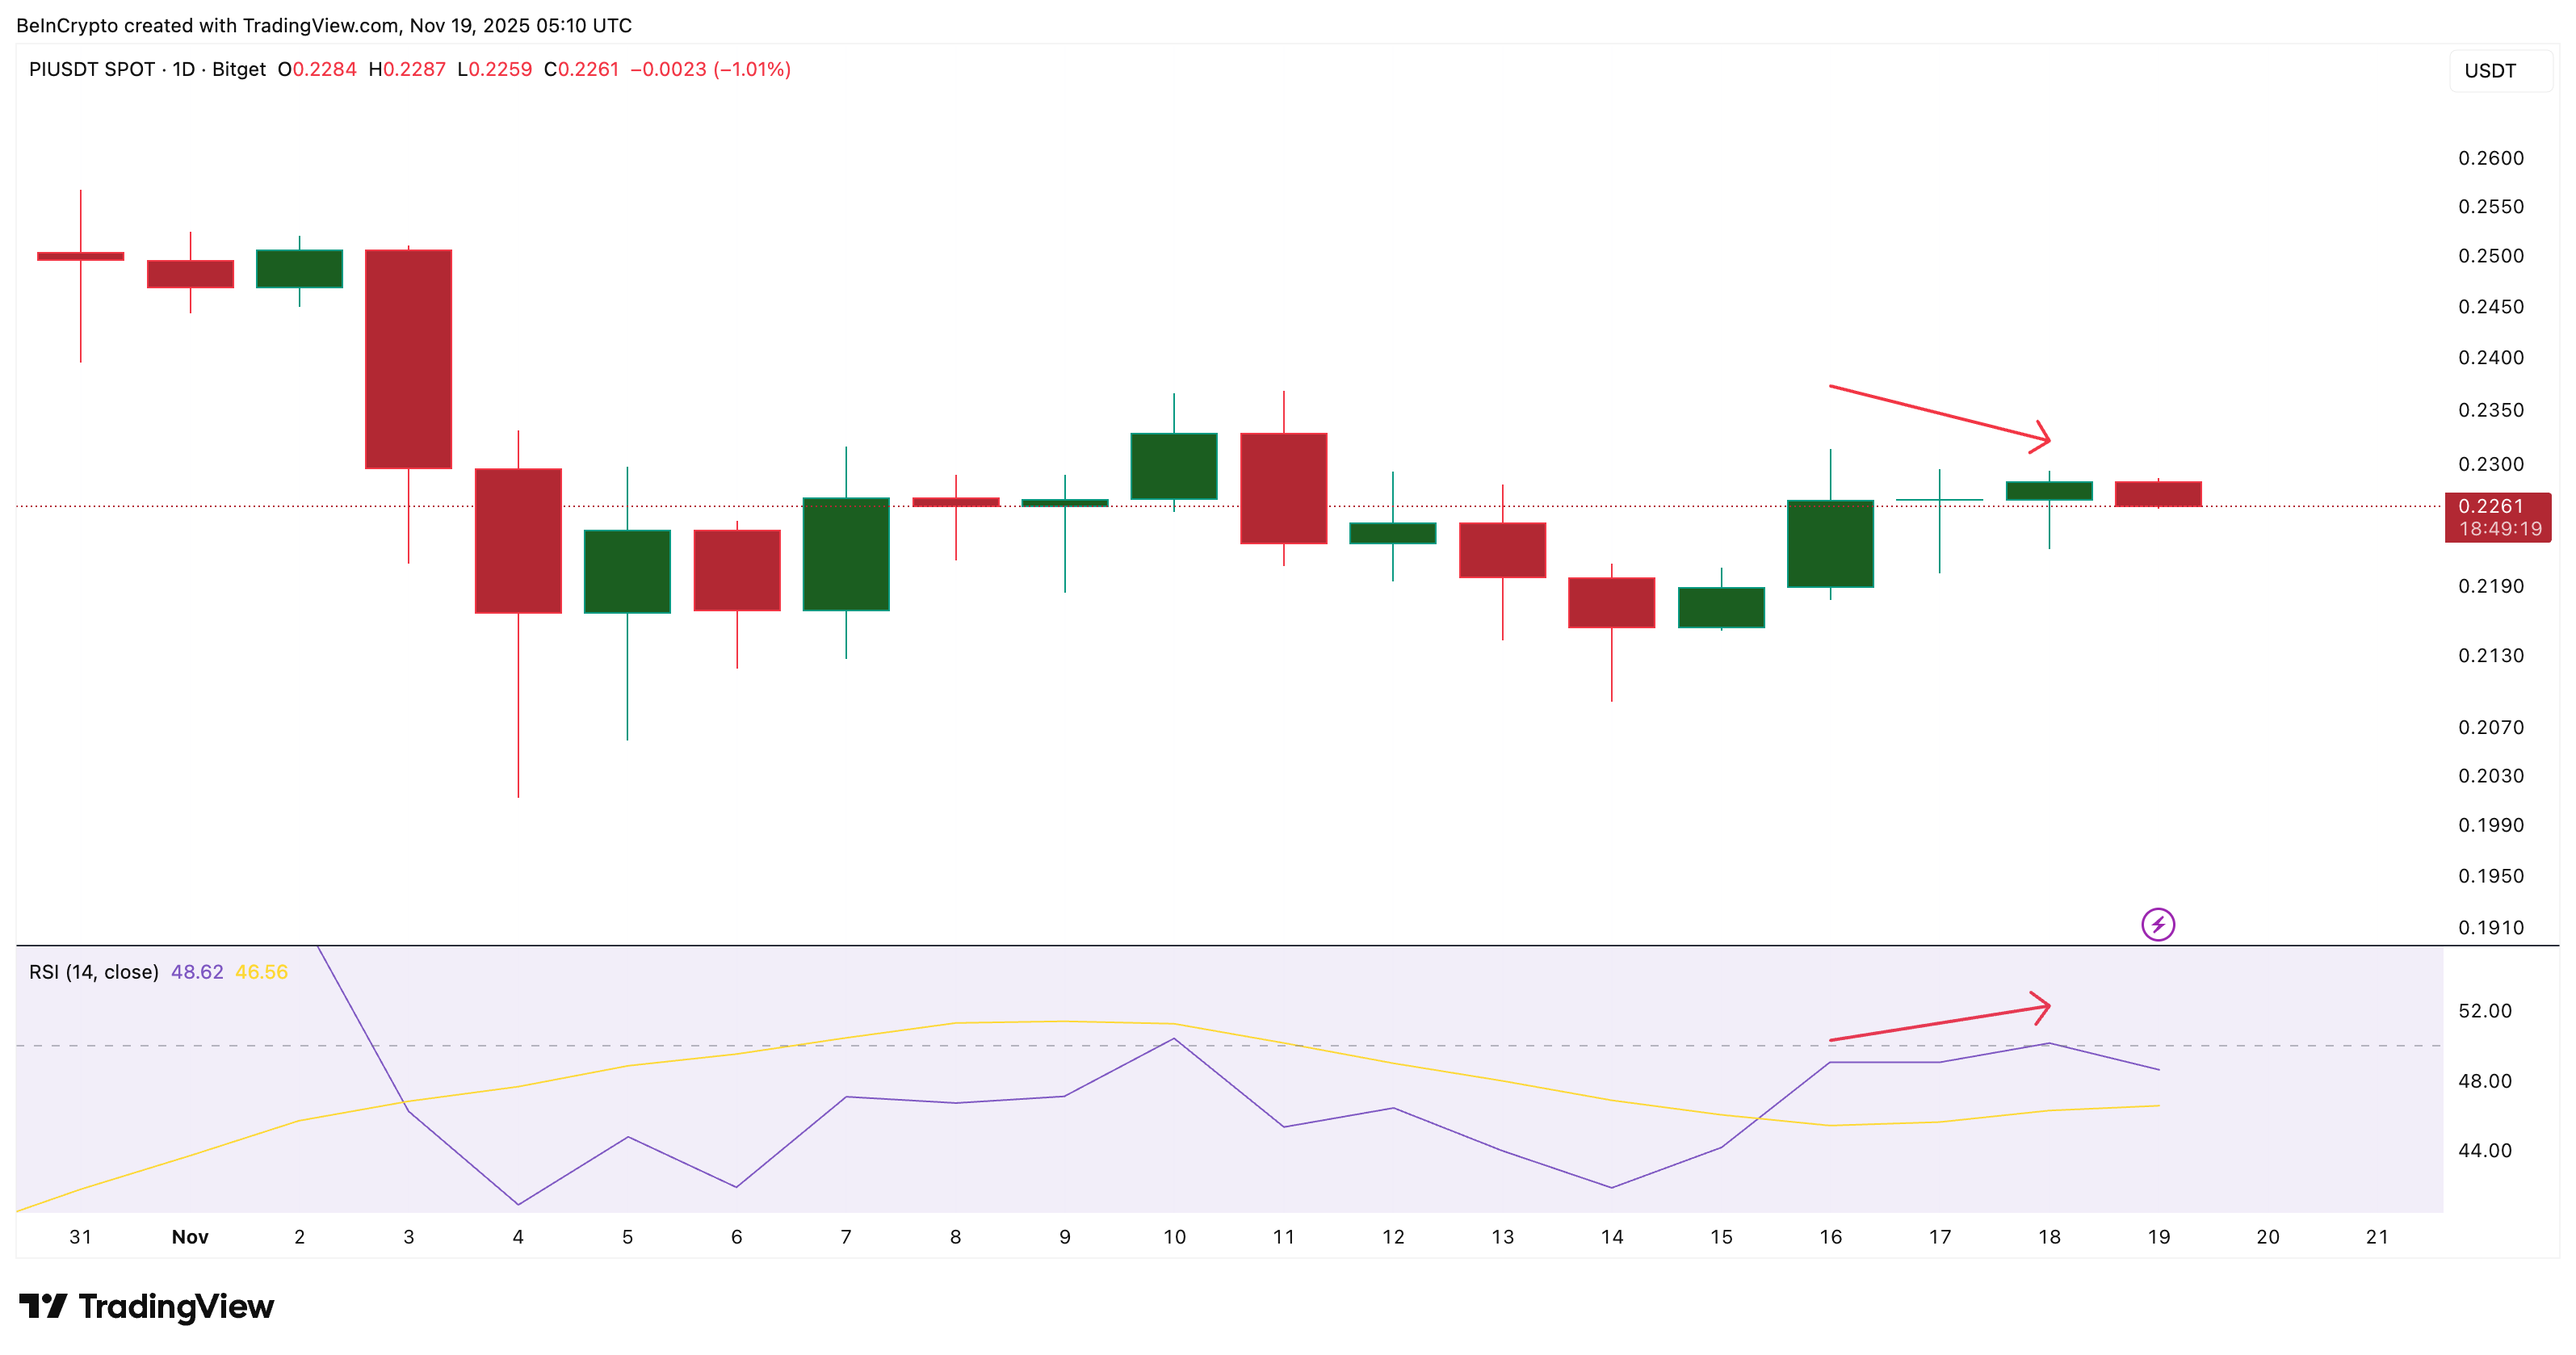 Hidden Bearish Divergence Flashes:
TradingView
Hidden Bearish Divergence Flashes:
TradingView
Together, these three signals show that Pi Coin’s recent bounce still sits inside a bigger downward structure.
Pi Coin Price Levels That Matter Now
If a deeper pullback starts, the first key level PI must protect is $0.219. Holding above this level keeps the bounce alive. Losing it opens the way toward $0.209, which is the base where the last rebound began.
If buyers want to invalidate the bearish signs, PI needs to reclaim $0.230 and then break $0.236 with strong volume. Only then would the short-term trend flip back to positive.
 Pi Coin Price Analysis:
TradingView
Pi Coin Price Analysis:
TradingView
Pi Coin price is still green on the monthly chart, but the latest structure suggests traders should stay cautious. The indicators show rising weakness, and unless PI clears its resistance soon, the pullback zone may come into play.
Read the article at BeInCryptoDisclaimer: The content of this article solely reflects the author's opinion and does not represent the platform in any capacity. This article is not intended to serve as a reference for making investment decisions.
You may also like
Bitcoin News Update: Fundamental Flaws Trigger $3 Trillion Cryptocurrency Collapse During Speculative Frenzy
- Cryptocurrency markets collapsed on Nov 21, 2025, with $1.93B in liquidations erasing $3T in value as Bitcoin and Ethereum plummeted amid unexplained volatility. - Speculative panic and structural fragility drove Bitcoin below $87,000 while 391,164 traders faced losses, highlighting market instability and regulatory gaps. - UK authorities seized $33M in crypto linked to Russian sanctions evasion, while Brazilian firm Rental Coins filed bankruptcy to recover fraud-linked assets. - Analysts warned of prolo
XRP News Today: As Confidence in Altcoins Rises, Investors Shift from Bitcoin and Ethereum to XRP ETFs
- XRP ETFs gained $118M inflows as Bitcoin and Ethereum ETFs lost $1.6B in outflows amid market turmoil. - XRP's institutional adoption and new fund launches, like Canary Capital's XRPC, drove its ETF success. - Bitcoin and Ethereum price drops below key levels raised concerns over market stability and crypto-treasury risks. - SEC regulatory clarity boosted altcoin ETF approvals, shifting capital toward XRP and Solana despite volatility.
Bitcoin News Update: Bessent's Public Key Appearance: Sign of Crypto Market Rebound or Indication of Further Decline?
- U.S. Treasury Secretary Bessent's unannounced visit to Pubkey Bitcoin bar sparked mixed reactions as Bitcoin fell below $85,500 amid macroeconomic uncertainty. - Market analysts warned against overreacting to signals like Bessent's visit, noting delayed interest rate cuts and equity weakness drive Bitcoin's 28% market cap drop since October. - Institutional buying ($835M) and increased short-term holder activity suggest market resilience, though $1B+ liquidations highlight structural fragility in late 20
ZEC slips by 0.08% as institutional investors show interest and positive fundamentals come to light
- Zcash (ZEC) surged 61.91% in a month despite a 6.29% 7-day drop, driven by institutional buying and privacy demand. - Cypherpunk Technologies , backed by Winklevoss twins, boosted ZEC holdings to $150M, now owning 1.43% of total supply. - A $19M short squeeze on Nov 20 triggered by whale liquidations pushed ZEC above $680, signaling bullish momentum. - Analysts project $800–$1,000 price targets if ZEC breaks $700, citing institutional adoption and decoupling from Bitcoin trends.