Date: Fri, Nov 21, 2025 | 04:45 AM GMT
Bitcoin’s sharp downturn continues to rattle the market, with the flagship cryptocurrency sliding another 7% in the past 24 hours and falling to $85,863 at the time of writing. This drop extends what has now become a severe correction from its October peak of $126,080, erasing the entirety of its 2025 gains and sending volatility across the space.
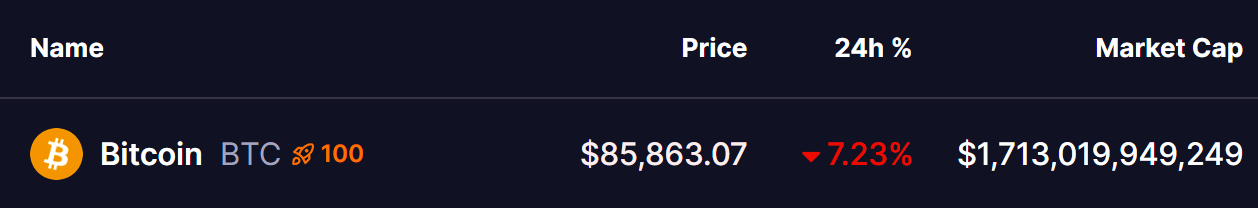 Source: Coinmarketcap
The latest plunge triggered nearly $956 million in market-wide liquidations. Long traders bore the brunt of the move, losing $836 million in a matter of hours as overleveraged positions were wiped out in a classic liquidation cascade.
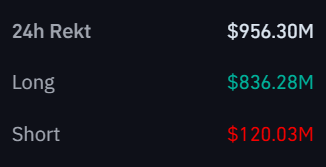 Source: Coinglass
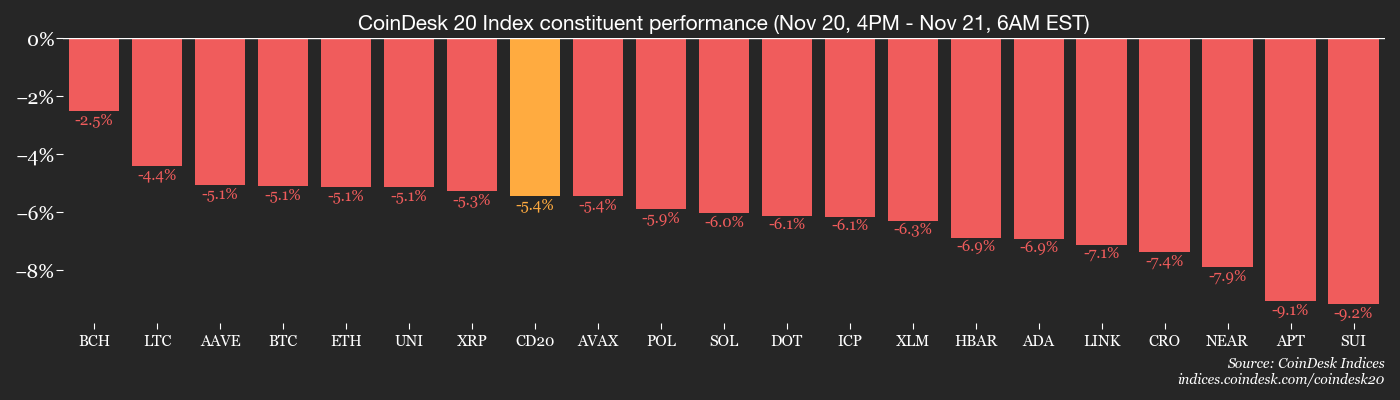
The widespread sell-off pushed the Fear & Greed Index down to 11 out of 100, firmly in “extreme fear,” while the global crypto market cap slipped by 6.6% to $2.24 trillion.
Why Bitcoin Crashed Toward $85,000
The downturn accelerated after the Bureau of Labor Statistics released its long-delayed September jobs report on November 20. The data came in much hotter than markets had anticipated, showing an addition of 119,000 jobs compared to expectations of just 50,000. Although unemployment rose slightly to 4.4%, the stronger labor data forced traders to scale back hopes for a December rate cut, with the probability dropping to roughly 40% according to CME FedWatch.
The situation became more complicated because there will be no standalone October payroll report. The federal shutdown from October 1 through mid-November halted data collection, meaning the October and November job numbers will be combined and released on December 16 — several days after the December 9–10 FOMC meeting. This leaves the Federal Reserve navigating an unusually uncertain environment without fresh labor data.
The combination of macro uncertainty and delayed economic numbers led to heavy selling among short-term Bitcoin holders. Analysts at CryptoQuant reported that more than 148,000 BTC were dumped at an average price of $96,853 as traders capitulated. The decline was amplified further when whale investor Owen Gunden reportedly offloaded 11,000 BTC, worth about $1.3 billion, accelerating the downward momentum.
A Potentially Bullish Fractal?
Despite the steep decline, the weekly chart reveals something noteworthy. Bitcoin’s current drop is unfolding almost exactly like its previous major corrections. In both the past cycles illustrated on the chart, BTC experienced a drawdown of roughly 32% from the top before sharply reversing into a new rally. Those rebounds produced gains of 121% in the first case and 68% in the second, ultimately pushing Bitcoin into fresh all-time highs.
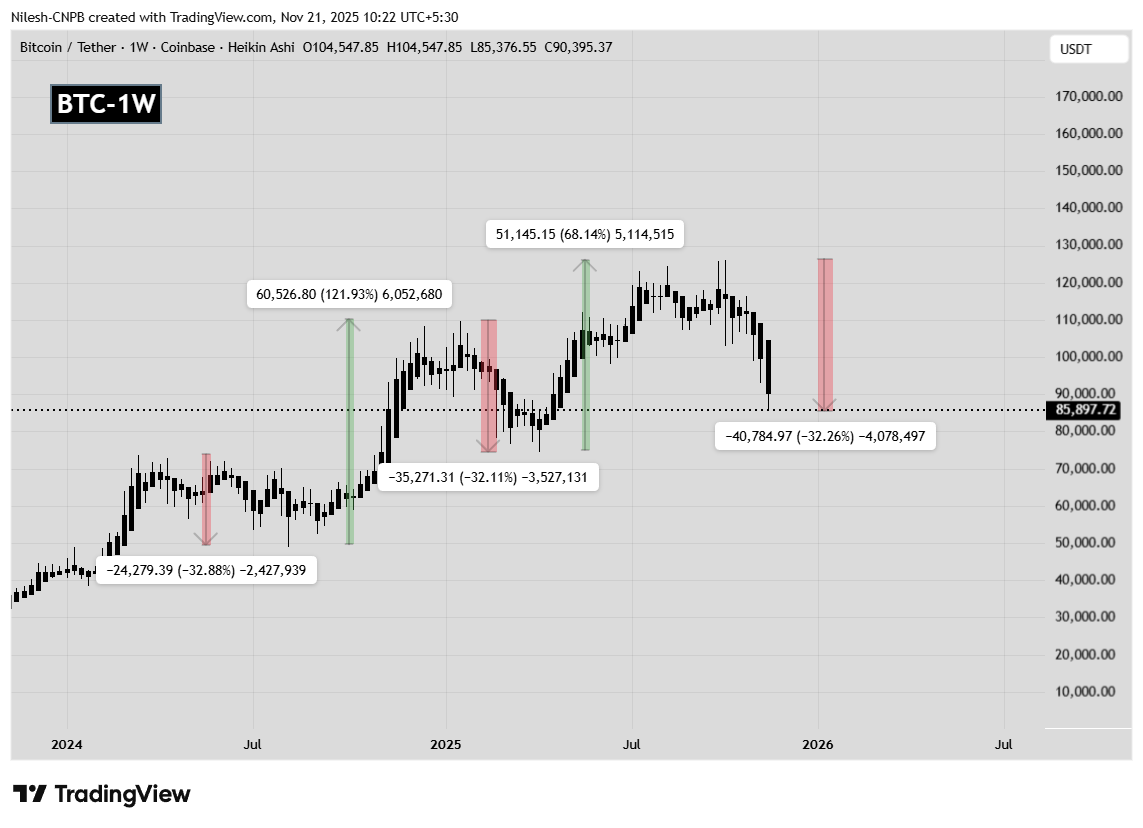 Bitcoin (BTC) Weekly Chart/Coinsprobe (Source: Tradingview)
The current correction has once again reached the same magnitude, with Bitcoin now down roughly 32% from its October peak and revisiting the $85,000 region. This repetition of structure has drawn attention from traders who believe Bitcoin may be completing another classic fractal setup. If the pattern continues to mirror its previous behavior, BTC could be approaching the end of its correction and preparing for a bullish reversal.
Of course, whether this fractal holds will depend on both investor sentiment and how the market digests upcoming macroeconomic developments. A stabilization above the current support could open the door for recovery, while further weakness may break the pattern entirely.