Bitget App
Trade smarter
Buy cryptoMarketsTradeFuturesEarnSquareMore
Ethereum (ETH) Sees Sharp Plunge — Could This Pattern Formation Lead to a Bullish Reversal?

Ethereum (ETH) Sees Sharp Plunge — Could This Pattern Formation Lead to a Bullish Reversal?

CoinsProbeCoinsProbe2025/11/21 12:30
By:Nilesh Hembade

Date: Fri, Nov 21, 2025 | 05:56 AM GMT

Ethereum is grappling with intense downside pressure as the broader crypto market remains deeply volatile. Over the past 24 hours, both Ethereum (ETH) and Bitcoin (BTC) have plunged nearly 7%, accelerating a painful correction that has now pushed ETH down more than 30% in the last 30 days. The sell-off triggered massive liquidations across derivatives markets, wiping out $954 million in positions, including $835 million in long side liquidations alone. The cascade flushed out over-leveraged traders and amplified panic-driven selling.

Yet despite the severe drop, the weekly chart of ETH reveals a developing harmonic structure that may hint at an upcoming recovery attempt.

Ethereum (ETH) Sees Sharp Plunge — Could This Pattern Formation Lead to a Bullish Reversal? image 0 
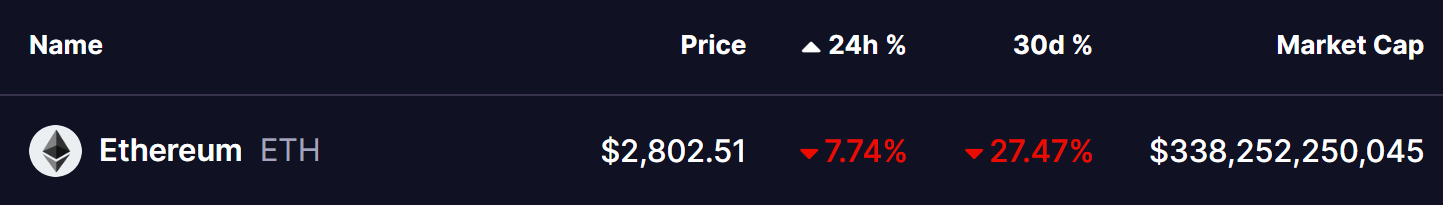
Source: Coinmarketcap

Harmonic Pattern Hints at Potential Bounce

On the weekly timeframe, ETH is shaping a potential Bearish ABCD harmonic pattern, a classical structure where the CD-leg typically offers a strong recovery rally before completing the final turning point at the Potential Reversal Zone.

The formation began at Point A near $2373.00, followed by a sharp surge into Point B, which marked a significant swing high. Price then retraced heavily into Point C at $2771.00, where sellers have started losing momentum and early buying interest is emerging. This C-level now acts as a critical support region, keeping the harmonic structure valid and suggesting that the CD-leg could be in its early development phase.

Ethereum (ETH) Sees Sharp Plunge — Could This Pattern Formation Lead to a Bullish Reversal? image 1 
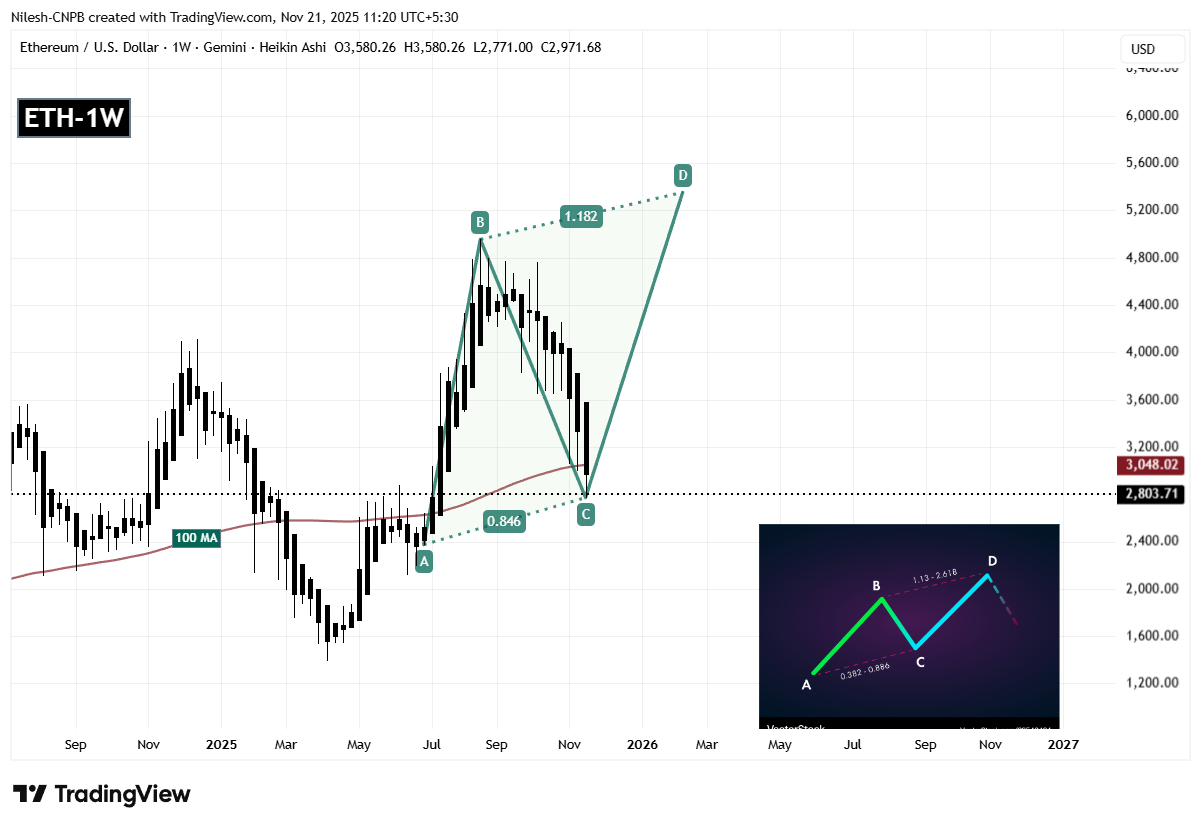
Ethereum (ETH) Weekly Chart/Coinsprobe (Source: Tradingview)

A reclaim above the 100 week moving average at $3048 would be a major signal that bullish momentum is strengthening.

What’s Next for ETH?

If buyers successfully defend the $2771.00 support and push ETH back above the 100-week moving average, the next key target sits near the Potential Reversal Zone at the 1.18 Fibonacci extension, estimated around $5353.00. This zone represents the completion point of the ABCD pattern and indicates nearly a 90% upside potential from current levels.

However, risks remain elevated. If ETH fails to sustain the C-leg support and breaks below $2771.00, the harmonic structure could be invalidated or postponed, opening the door to deeper downside exploration before bullish momentum can rebuild.

For now, the market’s next decisive move hinges on whether buyers can prevent further breakdown and reclaim lost technical levels.

0

Disclaimer: The content of this article solely reflects the author's opinion and does not represent the platform in any capacity. This article is not intended to serve as a reference for making investment decisions.

PoolX: Earn new token airdrops
Lock your assets and earn 10%+ APR
Lock now!

You may also like

QCP Capital: End-of-Cycle Strength Withstands Crypto Downturn and Global Uncertainty

- QCP Capital identifies late-cycle resilience in global markets, dismissing recession fears despite recent volatility and crypto declines. - Fed rate-cut odds drop to 30% amid inflation uncertainty, while Bitcoin/Ethereum fall 20% and BlackRock's ETF sees $523M outflow. - Qfin Holdings reports 39-49% Q4 net income decline, contrasting energy/logistics sector growth in LNG vessels and LFP battery demand. - Jacobs Engineering's 16% EPS growth highlights infrastructure demand, as QCP advocates late-cycle bet

Bitget-RWA2025/11/21 13:16
QCP Capital: End-of-Cycle Strength Withstands Crypto Downturn and Global Uncertainty

Bitcoin Latest Updates: IDC Warns of Legal Action Regarding Curve's Low-Valued Lloyds Acquisition Amid Crypto Market Decline

- Lloyds' $139M Curve acquisition faces legal threats from IDC Ventures, which claims the deal undervalues the firm by 80%. - IDC's 12% stake and Quinn Emanuel-backed lawsuit highlight governance disputes over opaque sale terms and leadership conflicts. - The $139M price tag contrasts sharply with Curve's $289M 2023 valuation, exacerbating investor distrust amid crypto market turmoil. - Bitcoin fell below $85K as $2B in leveraged positions collapsed, with analysts warning of systemic risks from thin liquid

Bitget-RWA2025/11/21 13:16
Bitcoin Latest Updates: IDC Warns of Legal Action Regarding Curve's Low-Valued Lloyds Acquisition Amid Crypto Market Decline

ARK Supports Nvidia's Dominance in AI Despite Concerns of a Market Bubble

- ARK Invest re-allocates $17M to Nvidia , betting on AI-driven growth amid crypto-linked equity purchases during a market slump. - Nvidia reports $57B revenue, exceeding forecasts by $2.1B, with $500B Blackwell/Rubin order backlog and 73.6% gross margin. - $15B Nvidia-Microsoft Anthropic deal intensifies generative AI competition, while analysts raise $250-$272 price targets for AI infrastructure leadership. - Market anxieties persist over AI sustainability: 61% Q3 revenue from four clients, AI "bubble" f

Bitget-RWA2025/11/21 12:56
ARK Supports Nvidia's Dominance in AI Despite Concerns of a Market Bubble

Treasury Targets Crypto: Sanctions Reveal Worldwide Network of Illegal Finance

- U.S. Treasury sanctions Canadian Olympian Ryan Wedding for leading a global drug network, designating 9 individuals/entities and cryptocurrency addresses linked to Bitcoin/Ethereum. - Actions target cross-border illicit finance, including Indian firms aiding Iran's oil trade and UK crypto networks laundering funds for Russian oligarchs/military suppliers. - Crackdown aligns with national security priorities, blocking crypto mining near nuclear sites and blacklisting Chinese AI firms tied to Huawei, while

Bitget-RWA2025/11/21 12:56
Treasury Targets Crypto: Sanctions Reveal Worldwide Network of Illegal Finance