Bitget App
Trade smarter
Buy cryptoMarketsTradeFuturesEarnSquareMore
Ethereum (ETH) to Bounce Back — This Key Emerging Pattern Formation Suggest So!

Ethereum (ETH) to Bounce Back — This Key Emerging Pattern Formation Suggest So!

CoinsProbeCoinsProbe2025/11/24 09:51
By:Nilesh Hembade

Date: Mon, Nov 24, 2025 | 05:25 AM GMT

The cryptocurrency market is starting the week with a sense of relief after last week’s turbulence, which dragged Ethereum (ETH) down to a low of $2624 before recovering above $2875. Despite recent volatility, ETH’s weekly chart is now hinting at a potentially powerful recovery setup driven by a developing harmonic structure.

Ethereum (ETH) to Bounce Back — This Key Emerging Pattern Formation Suggest So! image 0 Source: Coinmarketcap

Harmonic Pattern Hints at Potential Bounce

On the weekly timeframe, Ethereum appears to be forming a potential Bearish ABCD harmonic pattern. This classical structure generally indicates a strong upside movement during the CD leg—typically where price accelerates until reaching the final reversal area known as the Potential Reversal Zone.

The pattern formation started at Point A near $2188.98, followed by a significant rally to Point B. After that, ETH entered a steep correction phase into Point C at $2624.88. This C-leg is proving meaningful, as early buying pressure has already pushed price back above $2875. This level now acts as a critical structural support, reinforcing the idea that ETH may be beginning its CD-leg advance.
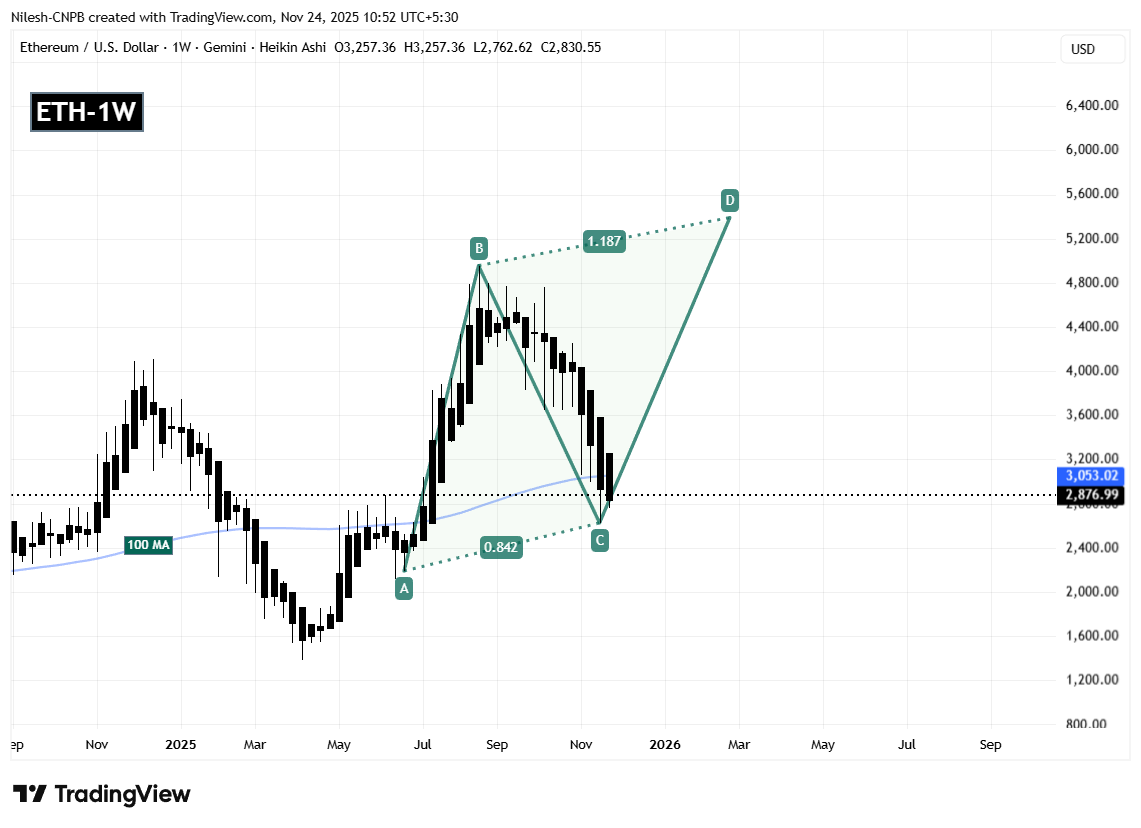
Ethereum (ETH) to Bounce Back — This Key Emerging Pattern Formation Suggest So! image 1 Ethereum (ETH) Weekly Chart/Coinsprobe (Source: Tradingview)

Another key technical factor supporting this outlook is the reclaim attempt above the 100-week moving average, currently sitting at $3053. Holding and closing above this level may serve as a strong signal that bullish momentum is returning.

What’s Next for ETH?

If buyers continue defending the $2624.88 support and ETH sustains movement above the 100-week MA, the next major objective lies near the Potential Reversal Zone aligned with the 1.187 Fibonacci extension. The projected completion area of the harmonic pattern sits near approximately $5391.87, which represents nearly an 86% potential upside from current price levels.

However, traders should remain cautious. A breakdown below $2624.88 would compromise the harmonic structure and potentially trigger deeper retracement before any meaningful bullish recovery occurs. Market participants will be closely watching weekly closes and reaction zones to gauge direction.

0

Disclaimer: The content of this article solely reflects the author's opinion and does not represent the platform in any capacity. This article is not intended to serve as a reference for making investment decisions.

PoolX: Earn new token airdrops
Lock your assets and earn 10%+ APR
Lock now!

You may also like

Solana Update: Bearish Pattern and Weakening Support Point to Solana's $99 Challenge

- Solana's SOL price faces bearish pressure, with technical indicators and on-chain metrics suggesting a potential drop to $99 if key support levels fail. - ETF inflows remain uneven, with Bitwise's BSOL ETF dominating 89% of assets but recent outflows signaling institutional caution amid weak retail demand. - The Upbit hot wallet breach triggered liquidity disruptions, while Nansen data shows 20% monthly declines in TVL, active addresses, and network fees. - Technical analysis highlights a bear flag patte

Bitget-RWA2025/11/27 16:50
Solana Update: Bearish Pattern and Weakening Support Point to Solana's $99 Challenge

Crypto Market Caught Between Surrender and Careful Buying as Underlying Fear Dynamics Change

- Crypto Fear & Greed Index rose to 19/100 from 15/100, remaining in "extreme fear" despite broader equity market pessimism. - Structural downturn driven by leverage, liquidations, and retail capitulation, with social media bullish sentiment at 2-year lows. - Unverified $15B Bitcoin breach and institutional moves (Grayscale ETF, Bybit India) highlight safety concerns and long-term confidence. - KAS, FLR, SKY show modest gains amid "altcoin season," but isolated rallies contrast with fragile market-wide cau

Bitget-RWA2025/11/27 16:50

Solana News Update: Changing Risk Preferences Lead to Outflows from Solana ETFs

- Solana ETFs recorded first outflows since launch, with 21Shares TSOL losing $34.37M in single-day withdrawals. - Price held near $141 despite bearish technical indicators and 20% drop in network TVL to $9.1B. - Institutional holdings remain strong at 6.83M tokens ($964M), but Upbit hack amplified short-term volatility. - Market recovery hinges on Fed's December rate decision and Solana's ability to stabilize key metrics.

Bitget-RWA2025/11/27 16:50

Bitcoin News Update: Optimistic Long Positions and Pessimistic Shorts Clash, Intensifying Cryptocurrency Market Fluctuations

- Hyperwhale shorted 1,000 BTC at $89,765 with 3x leverage, earning $10.6M but facing $1.16M losses as BTC trades at $106,443. - Aggressive bullish bets on Hyperliquid include a 20x $30M BTC long and $92.87M in leveraged longs, contrasting with $343.89M in 24-hour short liquidations. - BTC's RSI at 66 and 15/1 buy/sell signals reinforce short-term bullishness, while $5M POPCAT manipulation risks highlight exchange vulnerabilities. - LeverageShares' 3x BTC/ETH ETFs and compounding risks in products like UDO

Bitget-RWA2025/11/27 16:50
Bitcoin News Update: Optimistic Long Positions and Pessimistic Shorts Clash, Intensifying Cryptocurrency Market Fluctuations