Pi Coin Needs a 4% Push to Turn Recovery Into Rally — But a 5% Risk Still Lingers

Pi Coin price is down about 1.5% today, but its 7-day gain of 6.1% still beats the rest of the crypto market. It is also up around 15% this month, while Bitcoin has fallen nearly 20%. That shows how negatively correlated Pi has been, one of the reasons it keeps holding green candles even in
Pi Coin price is down about 1.5% today, but its 7-day gain of 6.1% still beats the rest of the crypto market. It is also up around 15% this month, while Bitcoin has fallen nearly 20%. That shows how negatively correlated Pi has been, one of the reasons it keeps holding green candles even in weak conditions.
But the move has been stuck in a narrow band between $0.24 and $0.22 since November 17. The chart now shows a tight 4–5% window where Pi Coin could break either up or down, depending on how a few signals resolve.
Large Buyers Still Supporting the Bounce
Pi Coin has one strong positive signal: bigger wallets continue to support the move.
Between November 19 and November 24, the price made a lower high while the Chaikin Money Flow (CMF) made a higher high. CMF measures whether big wallets are adding or exiting. This is a bullish divergence, meaning accumulation is happening even as price slows.
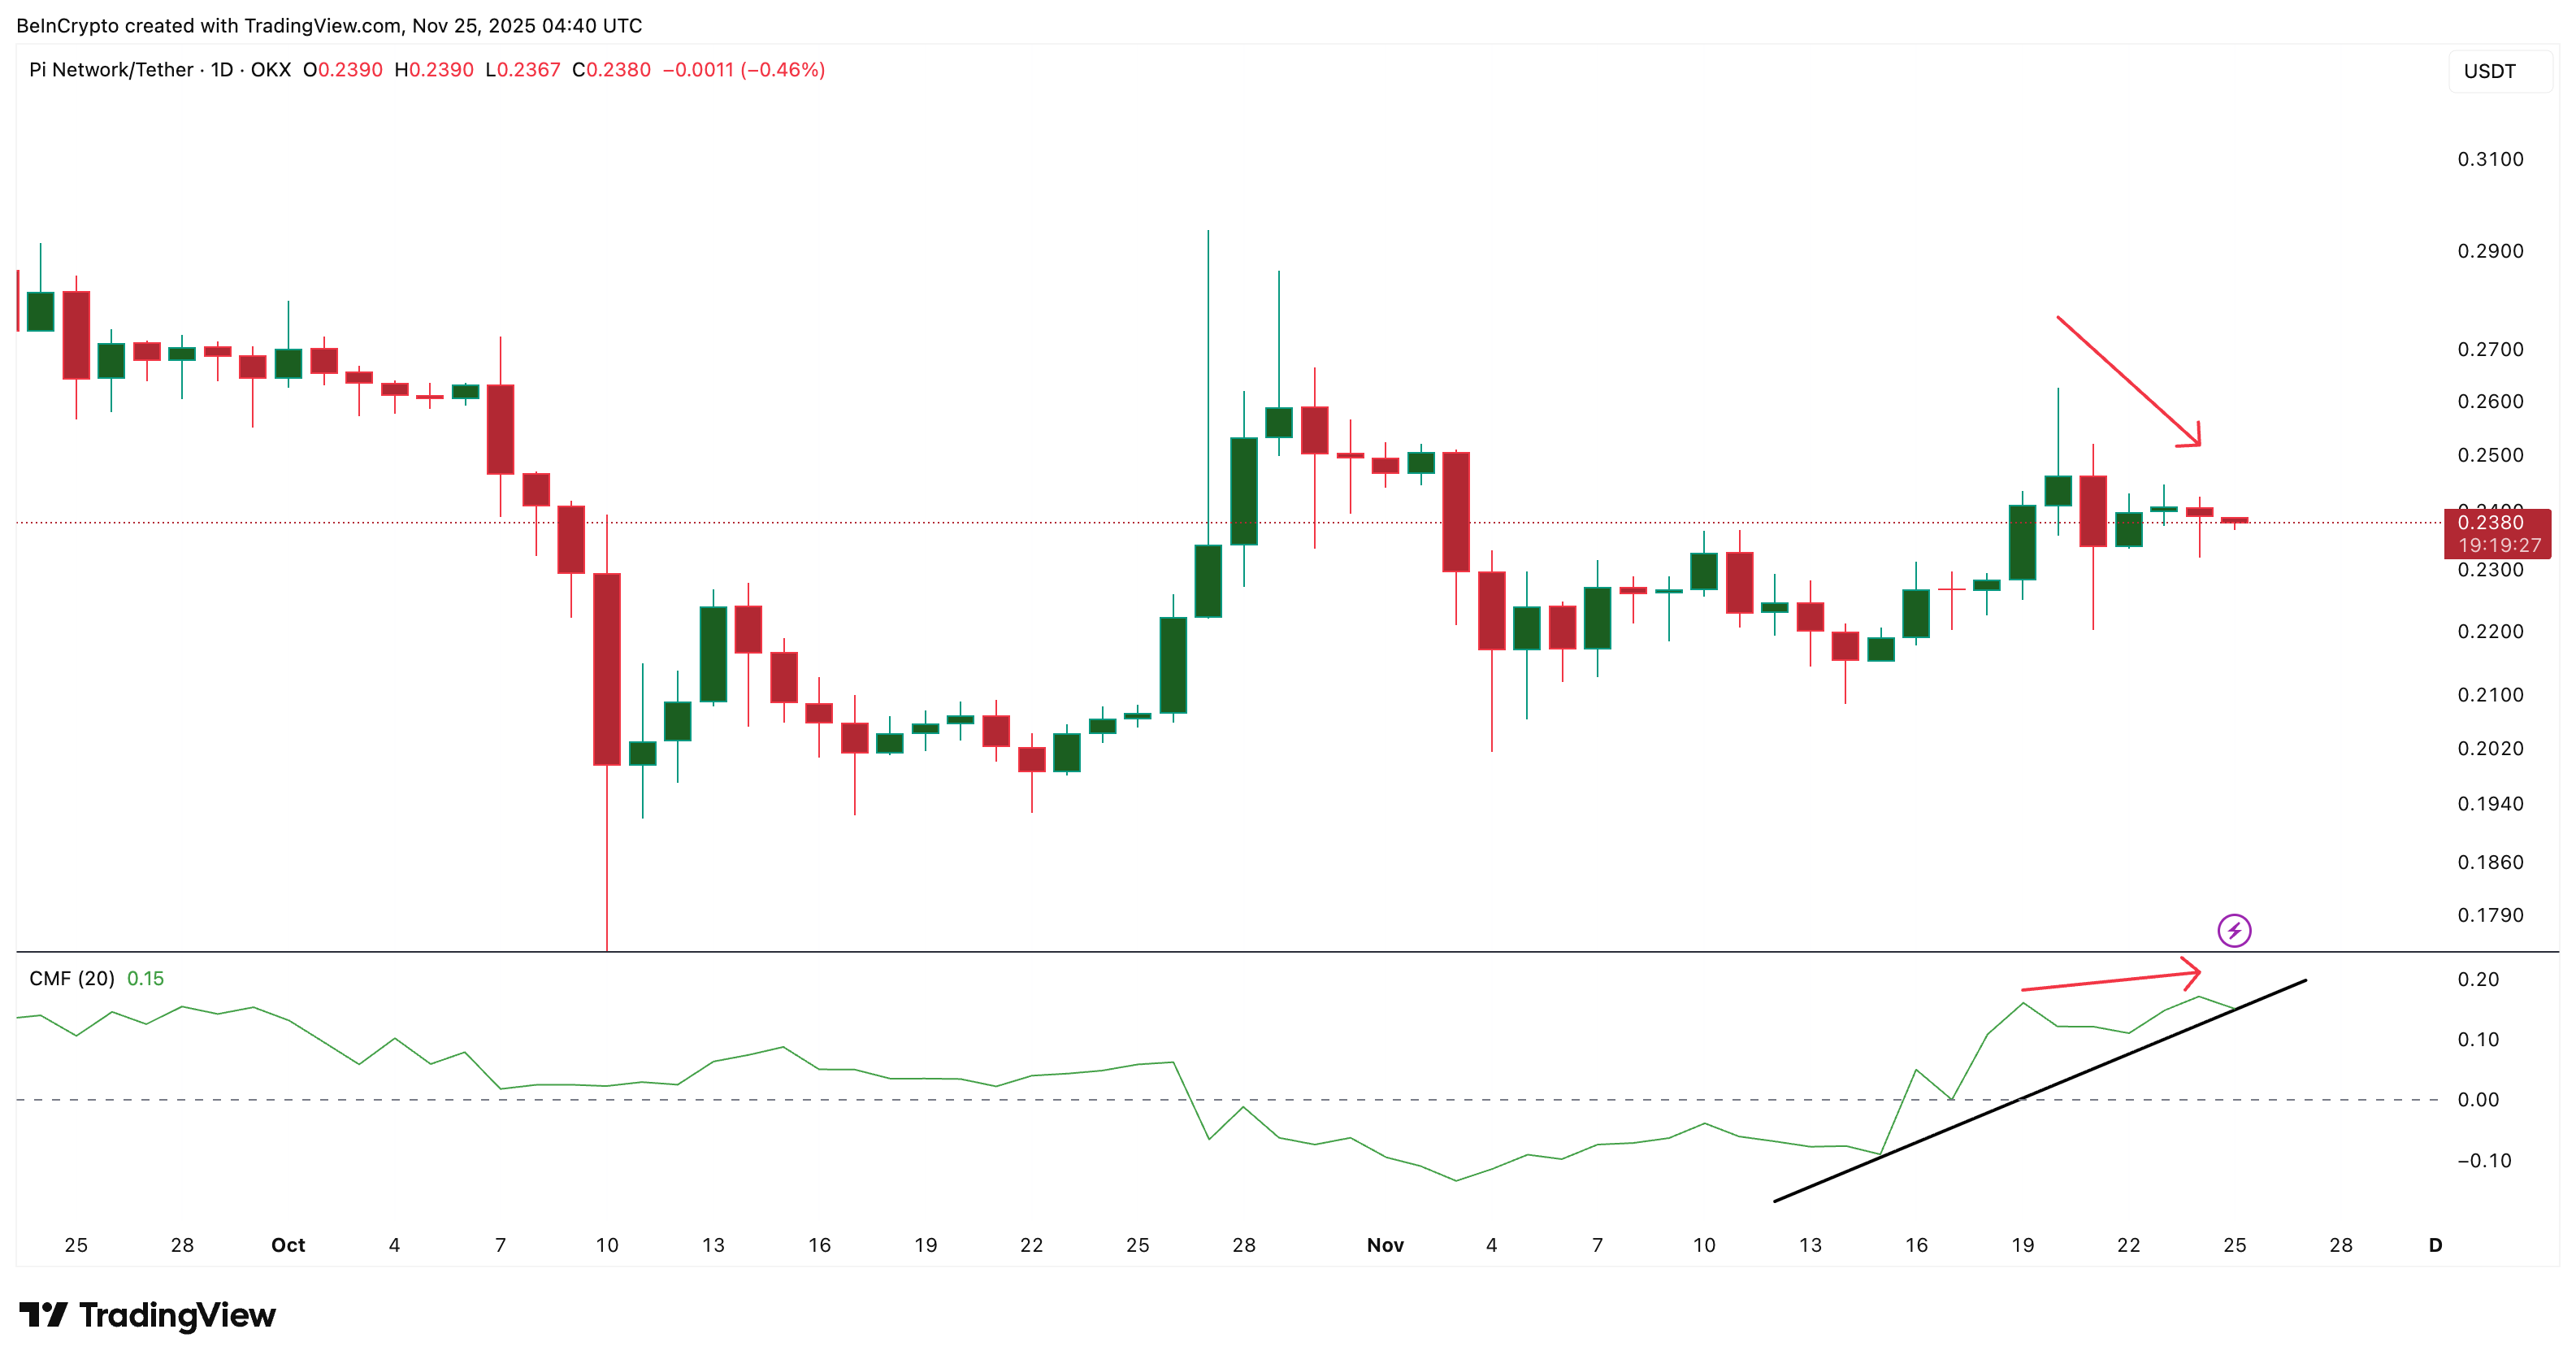 Money Flow Looks Strong:
TradingView
Money Flow Looks Strong:
TradingView
Want more token insights like this? Sign up for Editor Harsh Notariya’s Daily Crypto Newsletter.
CMF is also holding above its trendline and above zero. As long as it stays above that line, large-wallet support remains in place, and the bounce stays alive.
This is the only clean bullish signal the Pi Coin price has right now.
Retail Strength Is Weak, And Volume Support Is Missing?
Smaller buyers are not showing the same energy.
Between November 21 and November 24, the Pi Coin price made a higher low, but the Money Flow Index (MFI) made a lower low. MFI tracks dip-buying strength by combining price and volume. This is a bearish divergence, showing weaker retail buying.
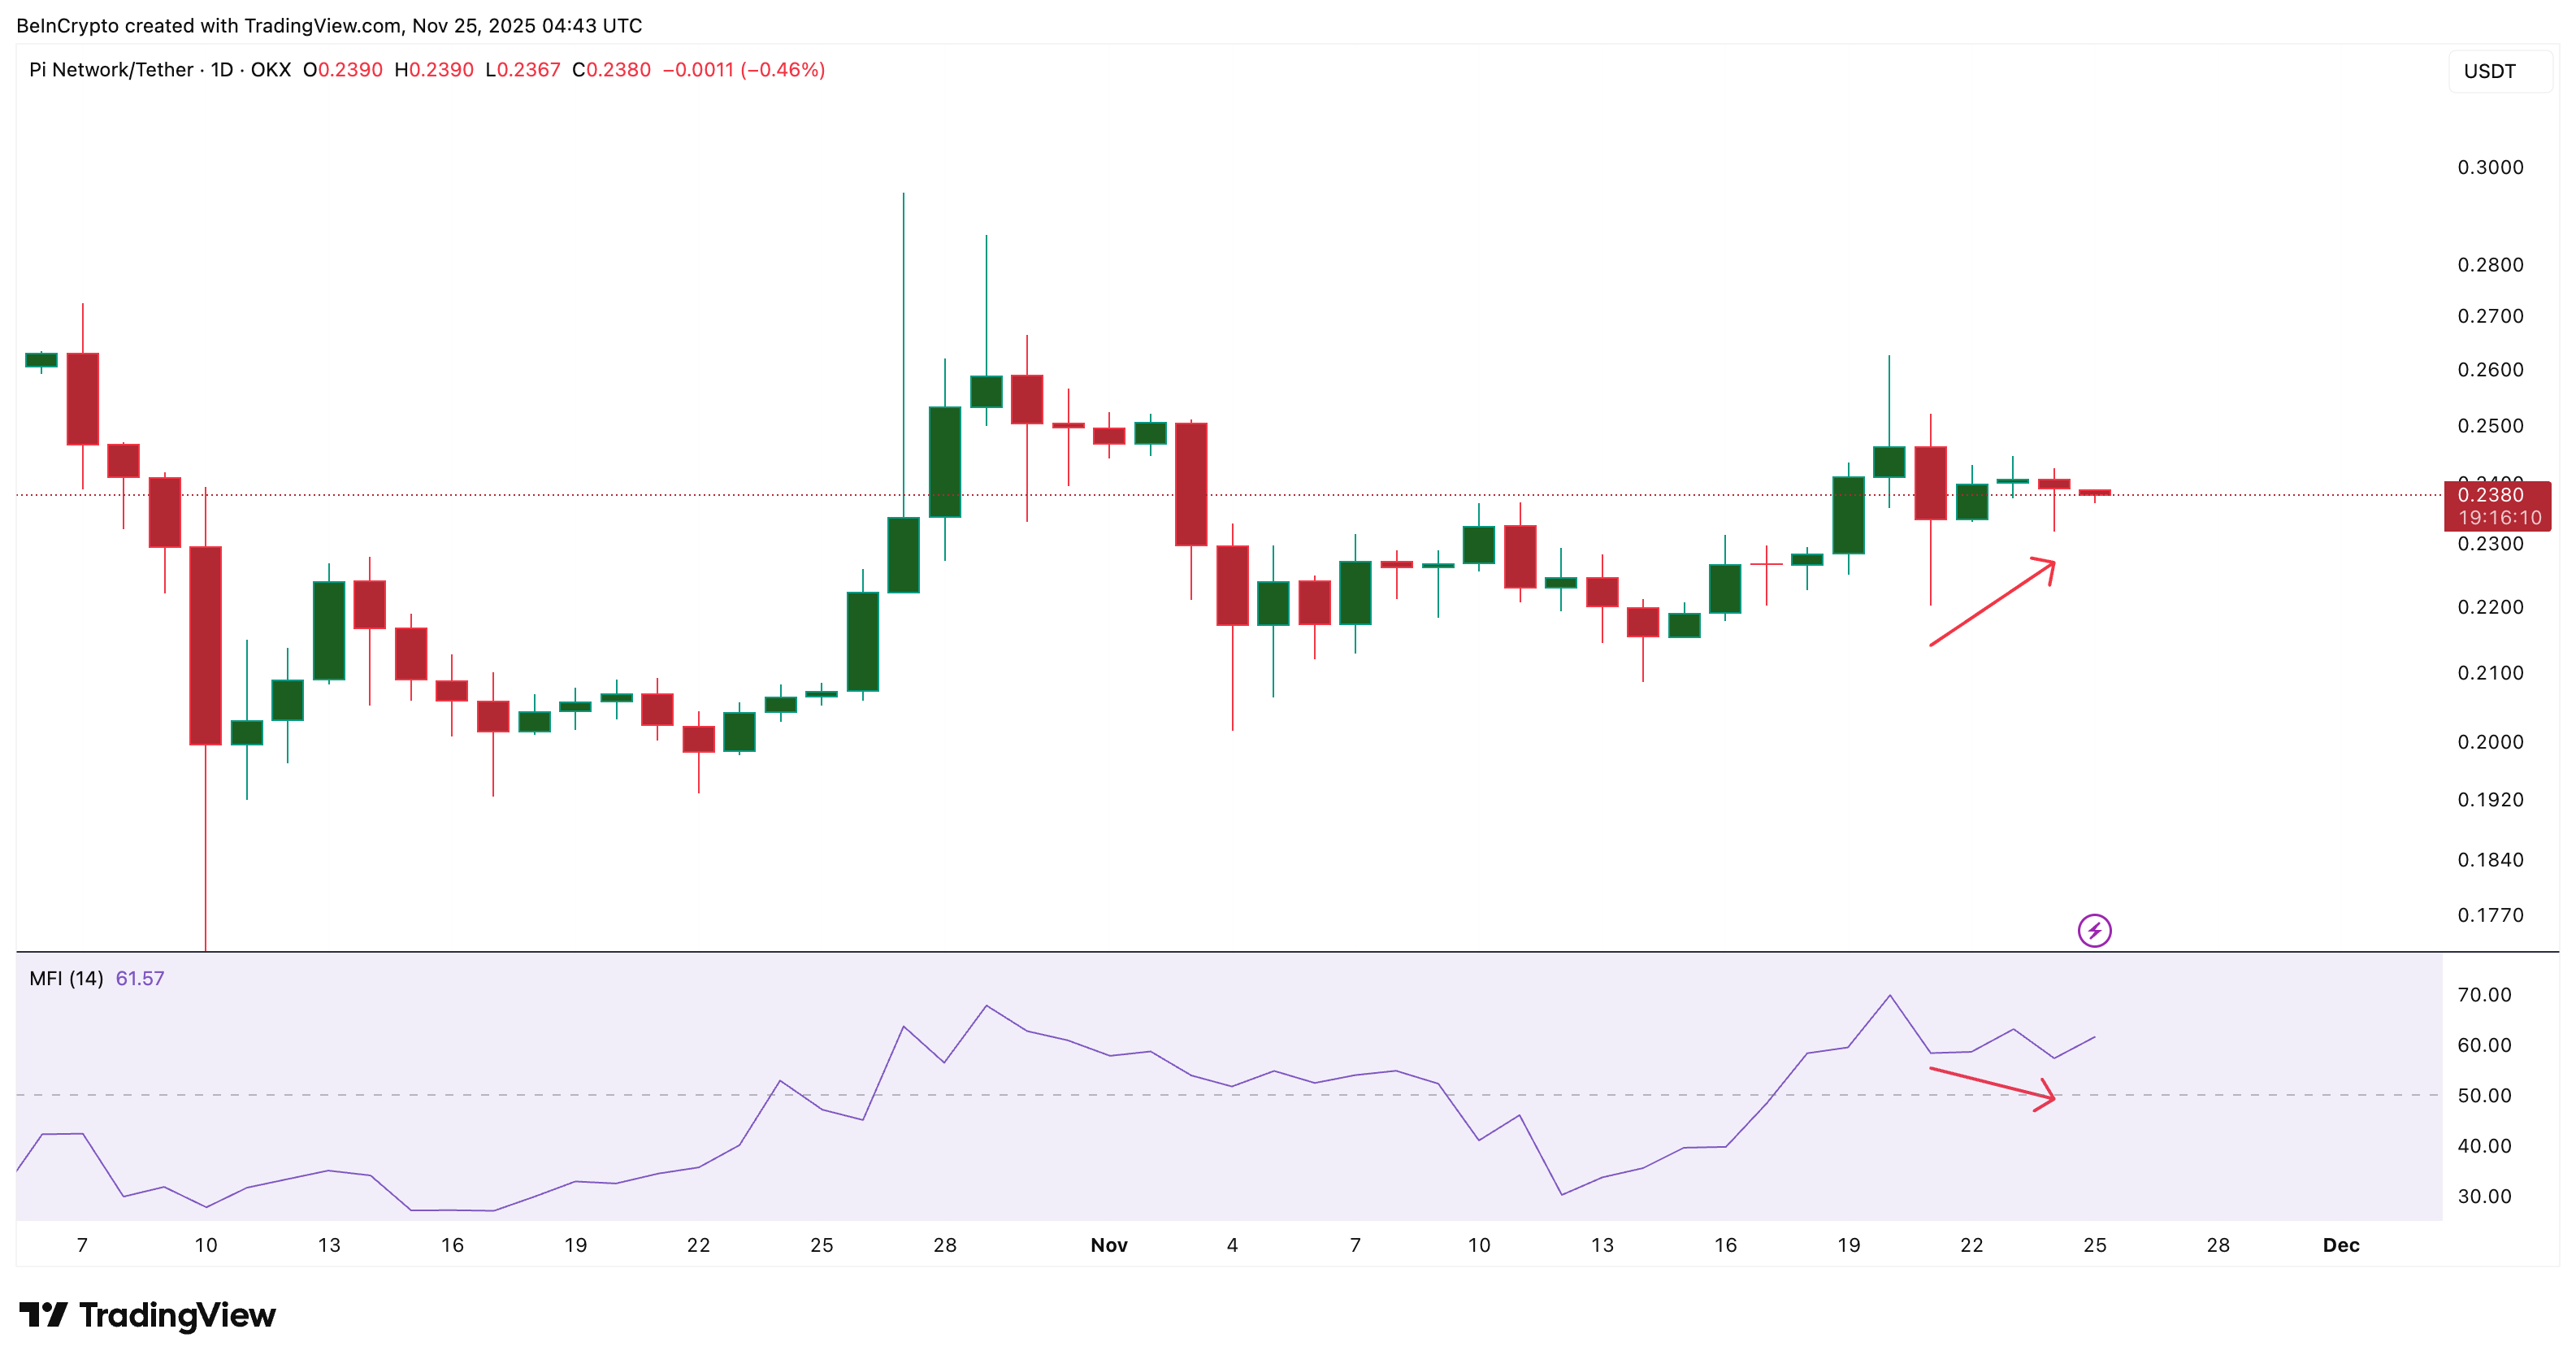 Weak Dip Buying Risks A PI Dip:
TradingView
Weak Dip Buying Risks A PI Dip:
TradingView
Volume confirms the same risk.
On-Balance Volume (OBV) is still below its key trendline near –1.97 billion. OBV measures whether fresh volume is entering the market. Until it breaks above that trendline, PI does not have enough participation for a strong breakout. And, a dip under the ascending trendline could weaken the volume support further.
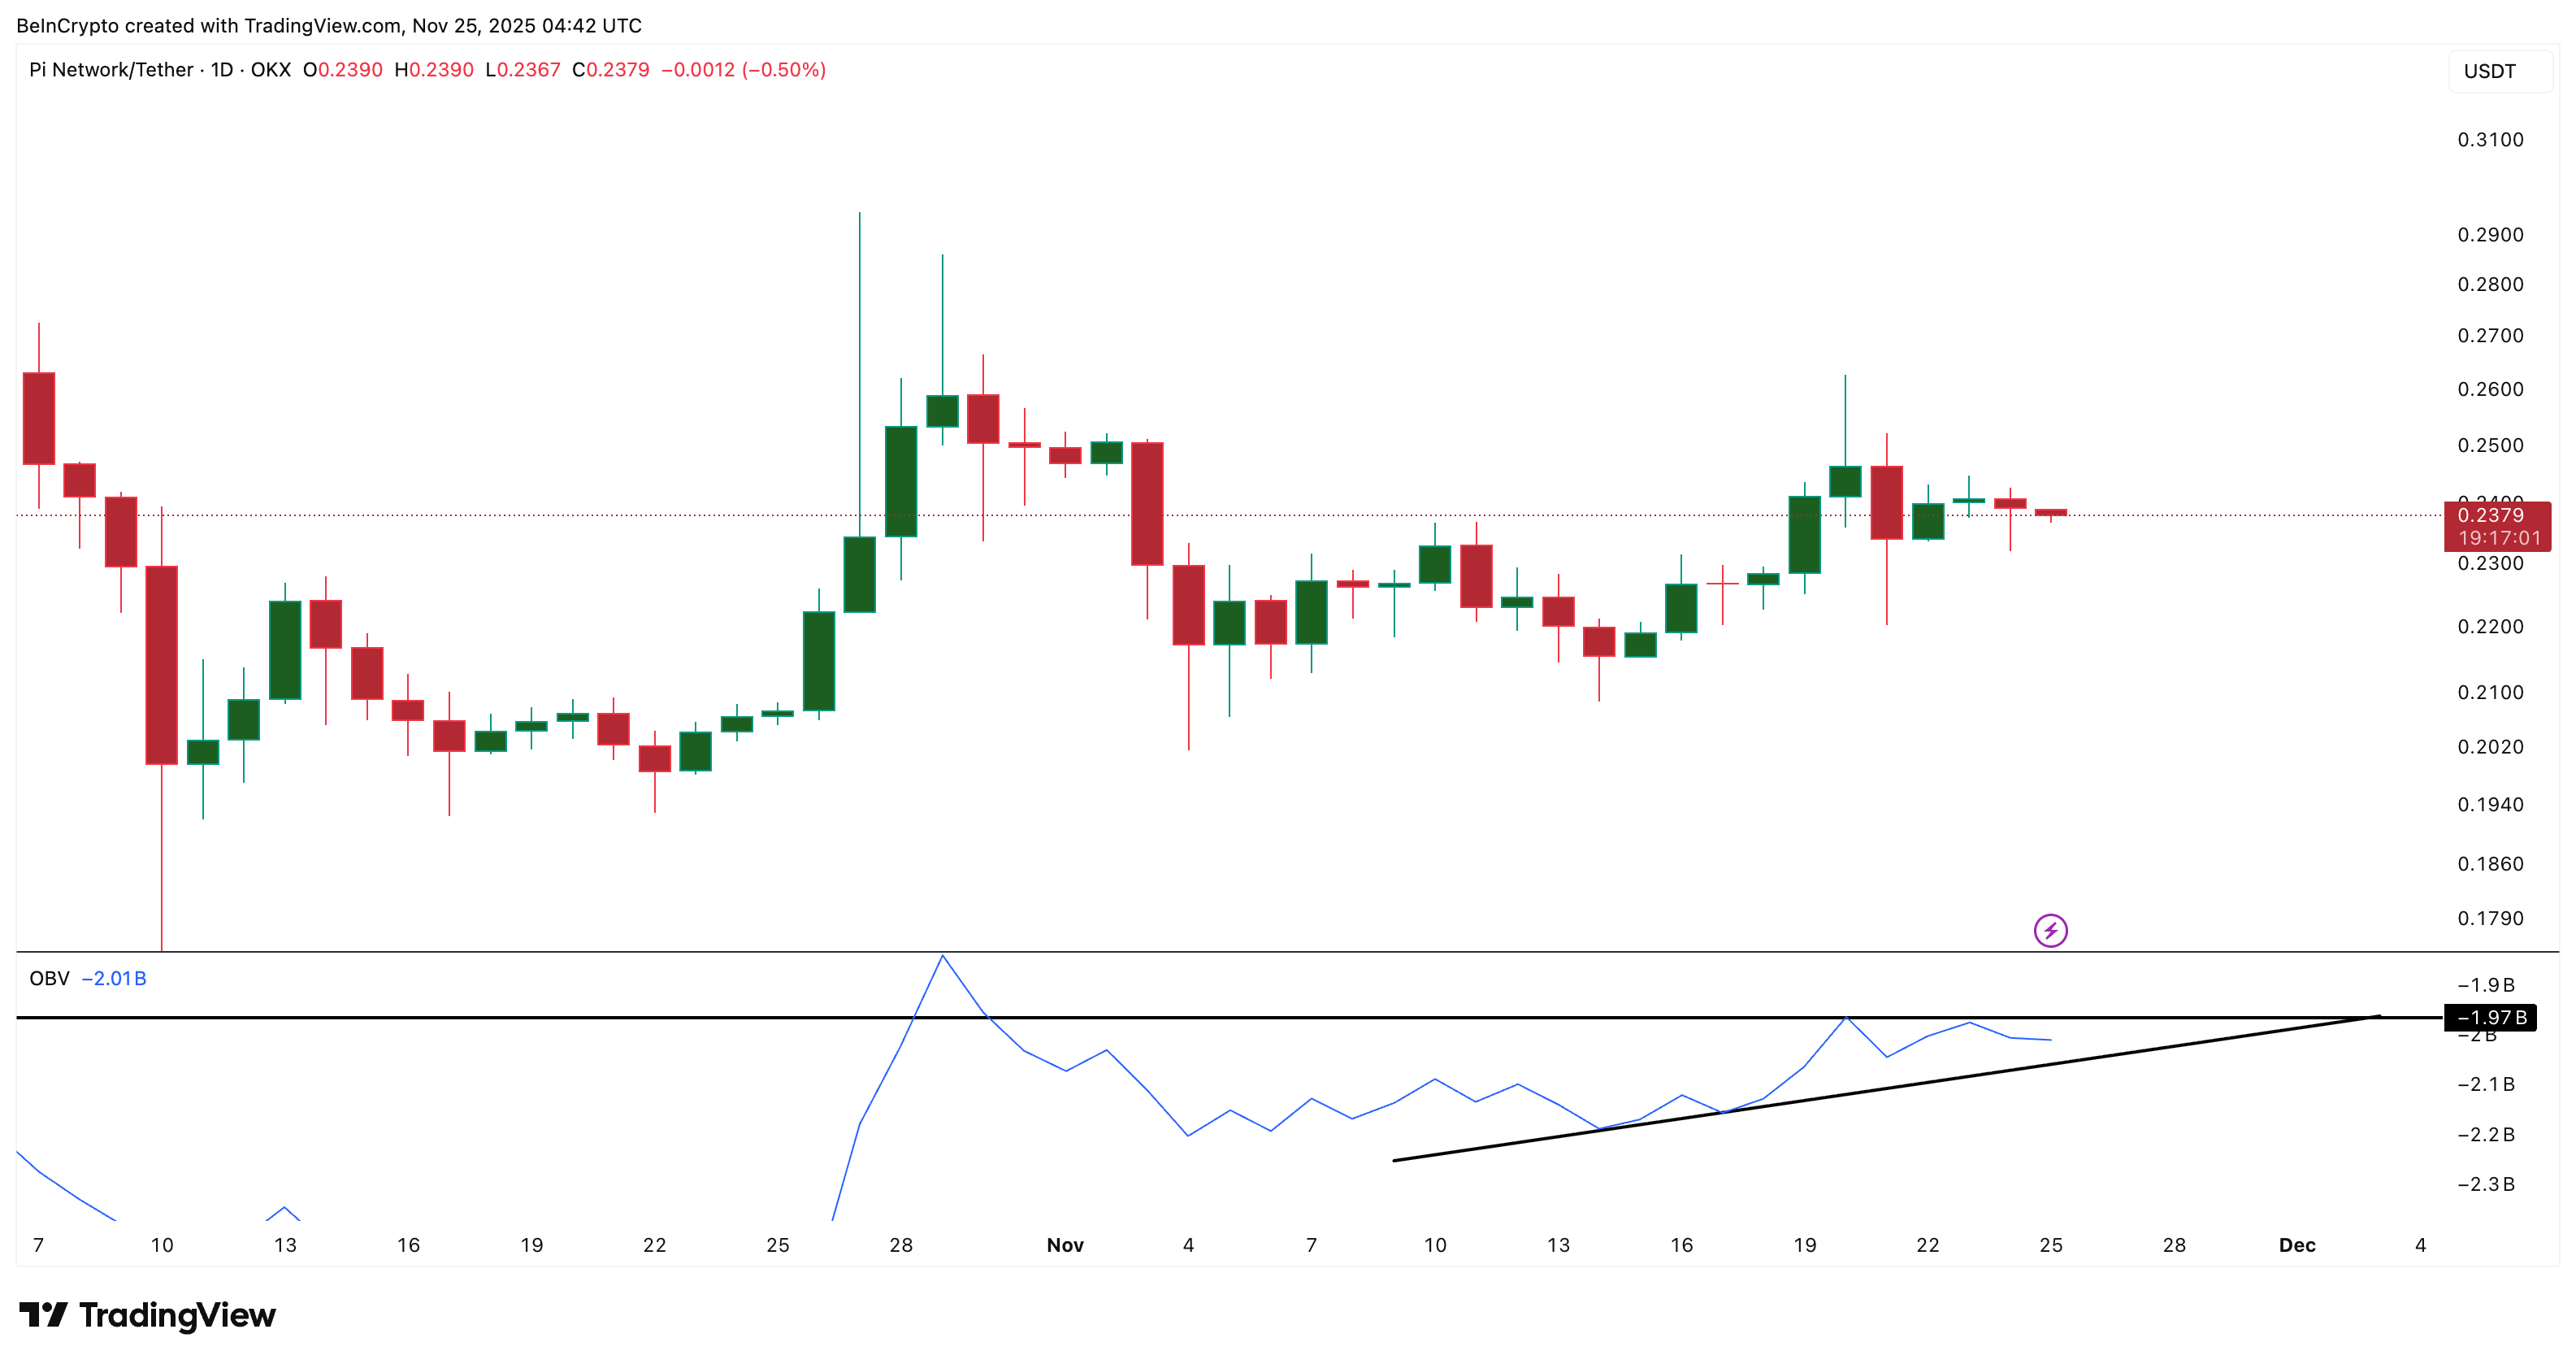 Volume Support Could Be The Pi Coin Price Decider:
TradingView
Volume Support Could Be The Pi Coin Price Decider:
TradingView
In short, big wallets remain supportive, but retail buying is still weak. Volume remains neutral and might be the indicator that decides the next Pi Coin price move.
Pi Coin Price: A 4% Breakout Or A 5% Breakdown
PI must break $0.24 to turn this recovery into a real rally. That level requires a 4.38% move and opens the door toward $0.26 and $0.29 if volume strengthens.
But the breakdown is close as well. A fall under $0.22 exposes $0.21. Dropping below $0.22 would mark a 5.49% decline and align with the bearish MFI divergences and neutral OBV.
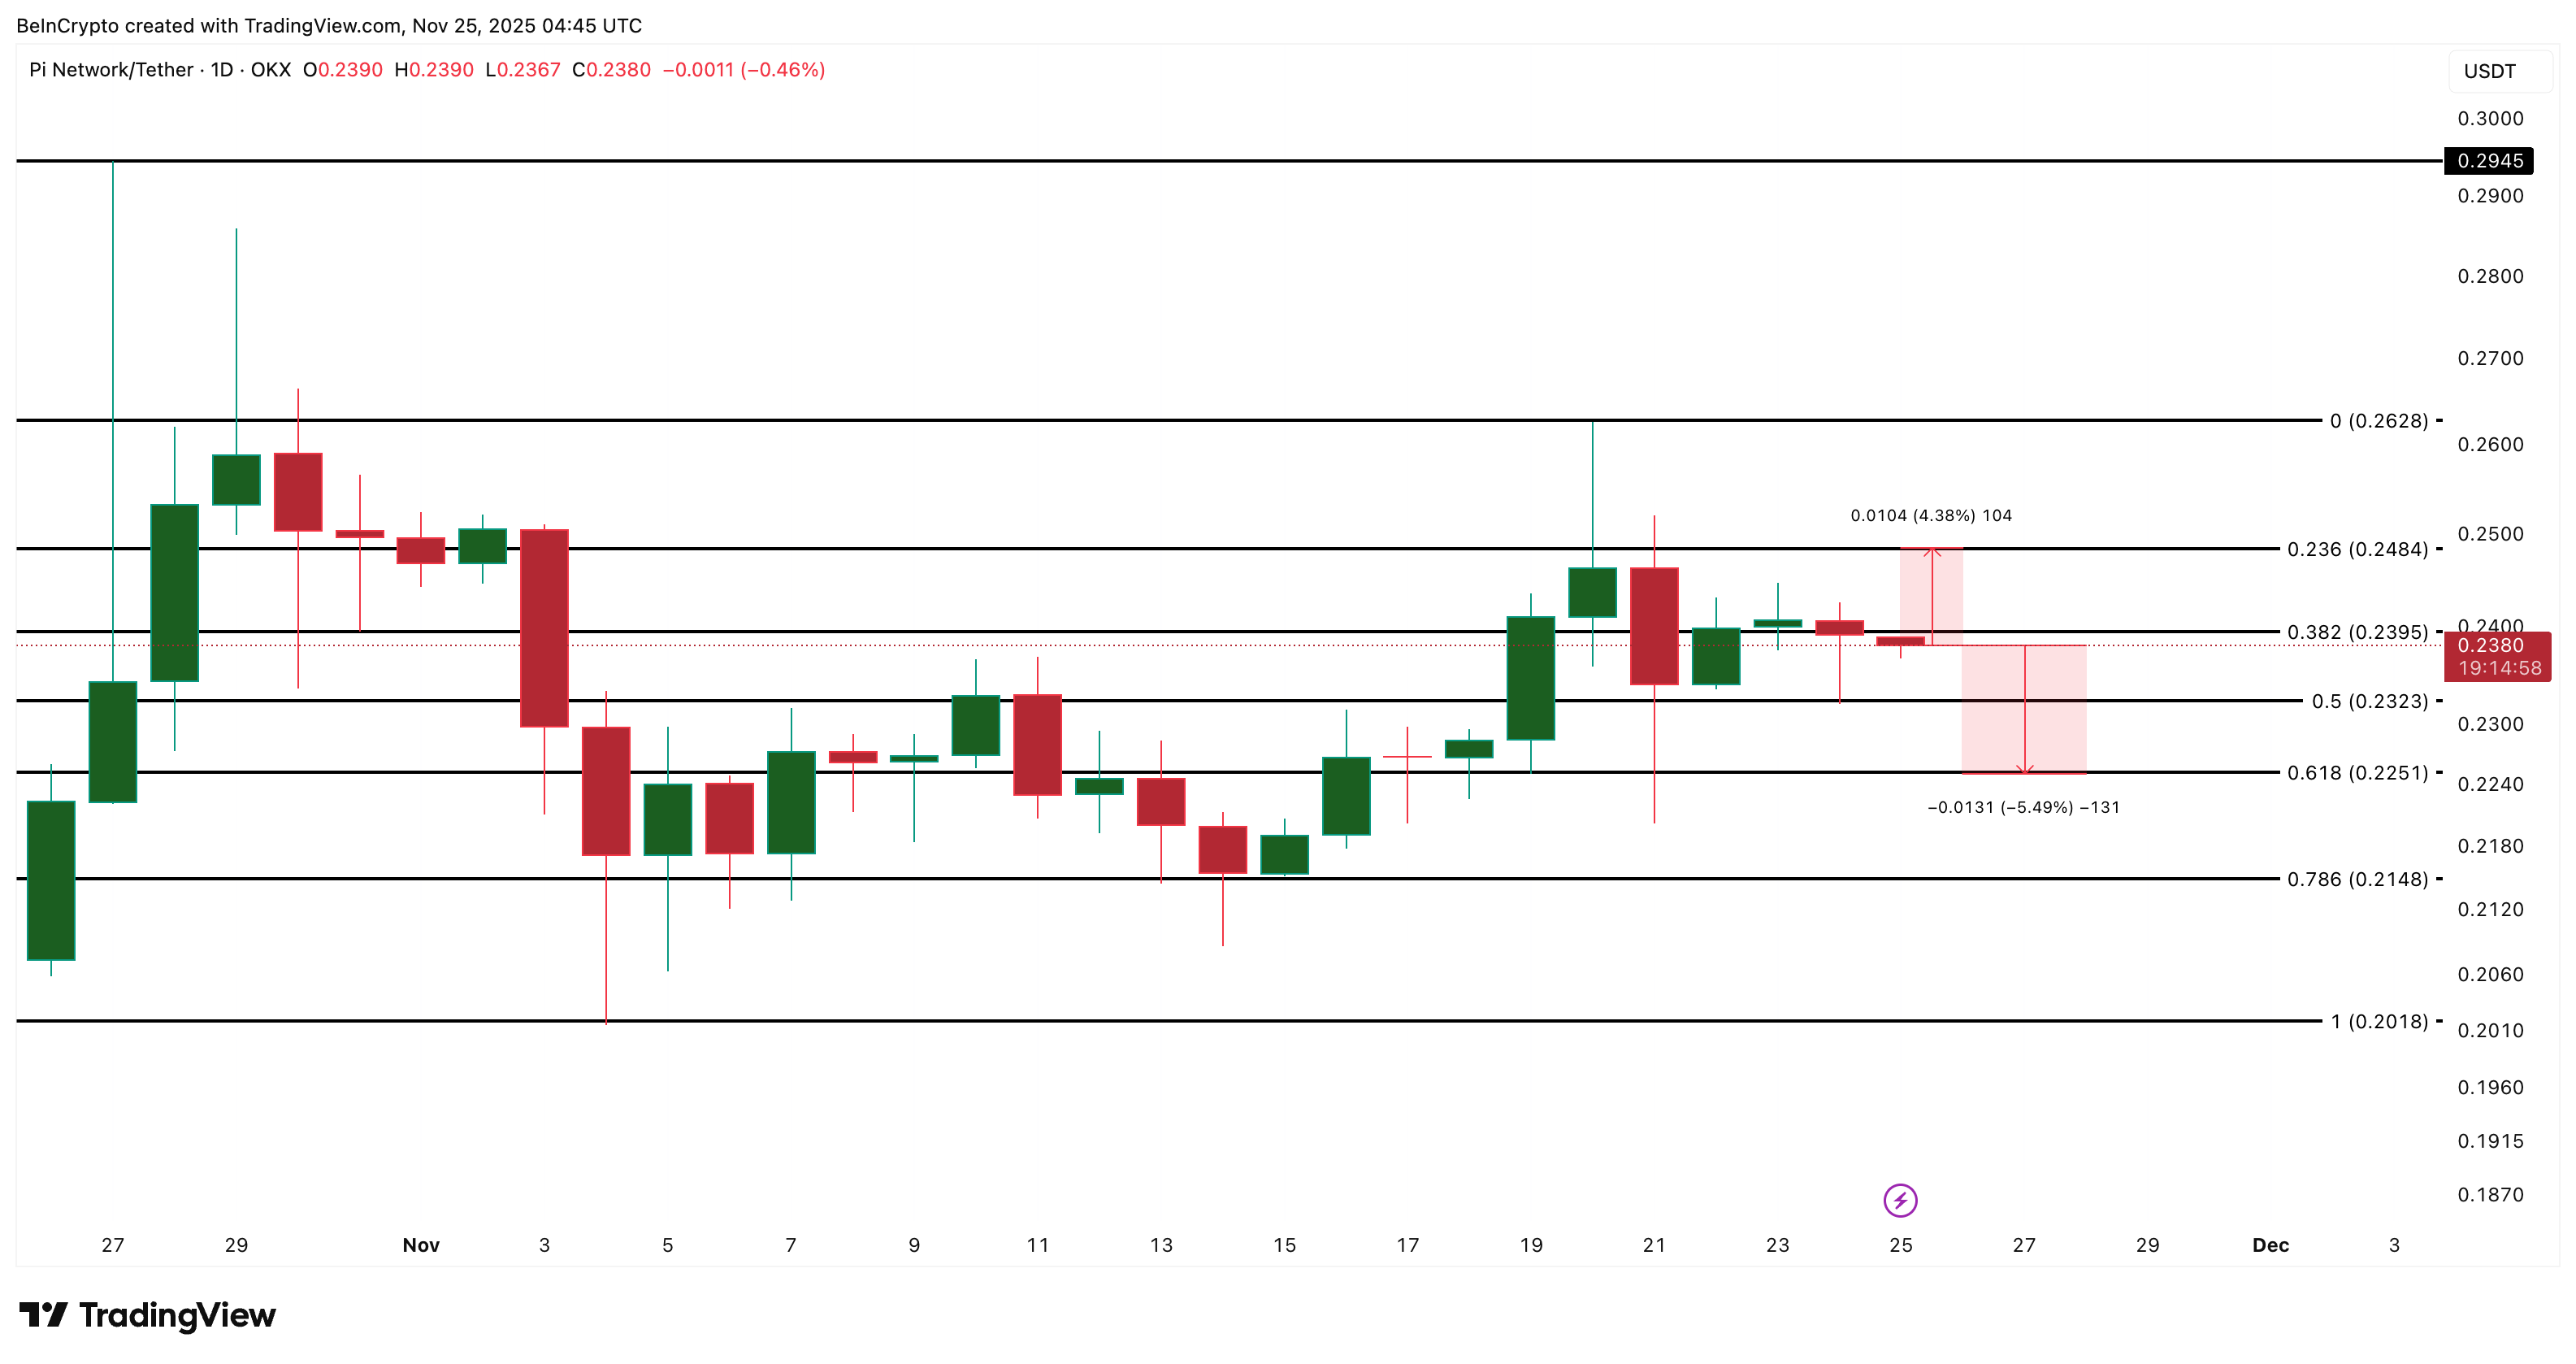 Pi Coin Price Analysis:
TradingView
Pi Coin Price Analysis:
TradingView
Right now, Pi Coin sits at a point where both outcomes remain equally close:
- CMF keeps the bounce alive and can help with the 4% upmove
- MFI and OBV keep pressure on the downside, exposing the 5% risk.
A clean break above $0.24 confirms strength. A clean drop under $0.22 confirms weakness. Either way, the Pi Coin price range could break soon.
Disclaimer: The content of this article solely reflects the author's opinion and does not represent the platform in any capacity. This article is not intended to serve as a reference for making investment decisions.
You may also like
ICP Value Jumps 30% Following Significant On-Chain Movements and Ecosystem Progress
- ICP's 30% price surge to $4.71 (Nov 2025) stems from tech upgrades, institutional adoption, and AI integration via Caffeine platform. - On-chain metrics show mixed momentum: 3.9% higher trading volume but 91% drop in token transfers during price dips, highlighting engagement volatility. - 2025 upgrades like Fission (subnet scalability) and Chain Fusion (cross-chain interoperability) boosted TVL to $237B, aligning with multichain trends. - Tokenomics balance 4-5% inflation with burning mechanisms, while M

BCH has surged by 35.79% since the beginning of the year, reflecting the overall positive sentiment in the market.
- Bitcoin Cash (BCH) fell 0.1% in 24 hours but rose 35.79% year-to-date, outperforming peers. - Sustained 7-day (7.55%) and 1-month (9.1%) gains highlight growing institutional and retail confidence. - Market adoption in DeFi and low-cost transactions, plus macroeconomic optimism, drive BCH's long-term appeal. - Analysts predict continued growth as BCH's ecosystem matures and on-chain activity rises.
Solana's Sharp Drop: Causes Behind the Fall and Future Prospects for Investors
- Solana's 30% price drop in late 2025 contrasts with strong on-chain metrics like 400ms finality and $35.9B DEX volume, but declining user engagement and rising NVT ratios signaled overvaluation. - Macroeconomic factors including high interest rates and institutional caution reduced speculative demand, with ETF inflows favoring staking products over direct price support. - Whale accumulation and RWA growth (up 350% YoY) suggest strategic buying during dips, though active address recovery and NVT normaliza