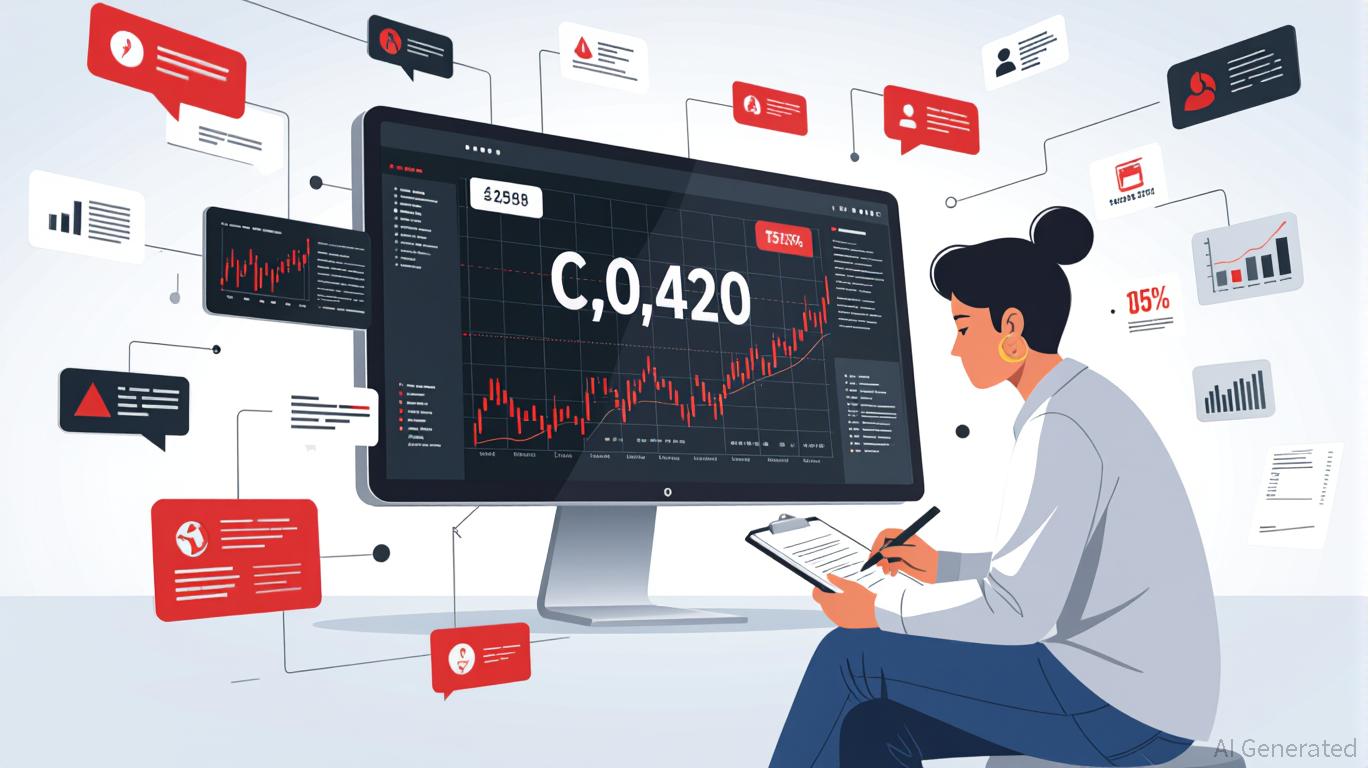
- $ZEC jumped almost 50 percent from the $300 to $350 zone and now trades near $450 as traders track the next step around the strong $500 resistance area.
- The chart shows a past peak between $700 and $750, then a long drop toward $300, where a heavy move formed, and then a new bounce that shaped a wide zone of interest.
- $ZEC may hold strength if it breaks and keeps above $500, though a failure near that level may allow a deeper fall that could extend far under the $200 mark again.
$ZEC posted a strong recovery from the $300 to $350 area and moved near $450 after gaining almost 50 percent as traders now watch the $500 resistance level for signs of the next directional shift. The chart showed a large green rebound from support as the price lifted sharply after a deep decline that followed its earlier peak around the $700 to $750 region.
The move built a new structure in the middle of the range where $ZEC now remains active while market participants look for evidence of strength or weakness at the next barrier.
$ZEC Follows a Clear Path of Major Swings
The recent rise followed a heavy decline of more than 55 percent from the previous all time high near $753.21, which pushed the token into the wide support band around the $300 line.
That region produced multiple reactions and the chart showed a strong recovery candle that initiated the current bounce. This bounce moved through the lower resistance band and carried $ZEC toward the upper section of the structure.
The mid zone created by the recovery stands between $428 and $450 and now acts as the active trading zone. This area formed after the prior drop was completed and buyers regained short-term control.
Market Watches the $500 Line for Direction
The $500 level was identified as the next major resistance area. The commentary stated that traders would monitor this line closely because a clear break and hold above $500 may open further upside. If $ ZEC fails at that point, the chart suggests there is still risk of a deeper pullback that could extend beneath the $300 support. Some projections listed potential targets even under the $200 mark if pressure increases.
This creates a pivotal moment for participants since the $500 level may determine whether $ZEC continues its rebound or returns to the lower bands shown in the image.
Price Structure Shows Key Fibonacci Zones
The chart displayed Fibonacci retracement levels, including 0.382 at $259.25, 0.5 at $186.48, 0.618 at $134.14 and 0.786 near $83.92. These levels mark deeper corrective areas if the token cannot push through resistance.
A large fair value gap also appeared near the $134 range, which remains open and could attract price if momentum weakens. This region formed earlier in the trend and still stands unfilled. The upper resistance zone near the all-time high displayed red shading where multiple failed attempts created the ceiling. Those repeated rejections formed the foundation for the later decline toward the $300 region.
Price action currently sits above $428 and remains inside the recovery block where the chart records a gain of more than 50 percent from the lows. Traders continue monitoring the current candles to see if momentum grows as $ZEC approaches $500. The structure reflects a market that moved sharply in both directions and now stands at a possible turning point as it waits for a clear outcome at the resistance zone.