BTC Market Pulse: Week 51
Bitcoin rejected firmly at the $94K level and fell toward the $87K region, unwinding recent upside momentum and re-establishing a more defensive market tone.
Overview
Momentum weakened meaningfully as the 14-day RSI fell back toward neutral territory, while spot market conditions deteriorated. Spot CVD moved sharply deeper into negative territory, signalling rising sell-side aggression, and spot volume continued to compress toward its lower statistical band, highlighting thinning liquidity and reduced conviction behind price moves.
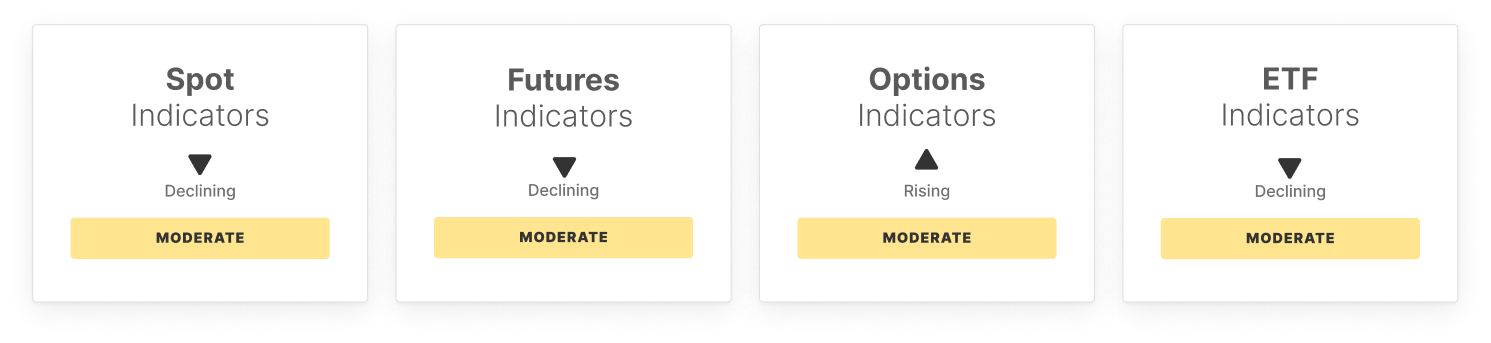
Derivatives positioning remains cautious. Futures open interest edged lower, pointing to light de-risking rather than capitulation, while perpetual CVD dropped well below its lower band, reflecting dominant sell pressure. Funding rates rose despite the drawdown, suggesting persistent long-side positioning that may remain vulnerable if weakness persists. Options markets show steady engagement, with open interest stable, volatility spreads deeply negative, and elevated skew indicating sustained demand for downside protection.
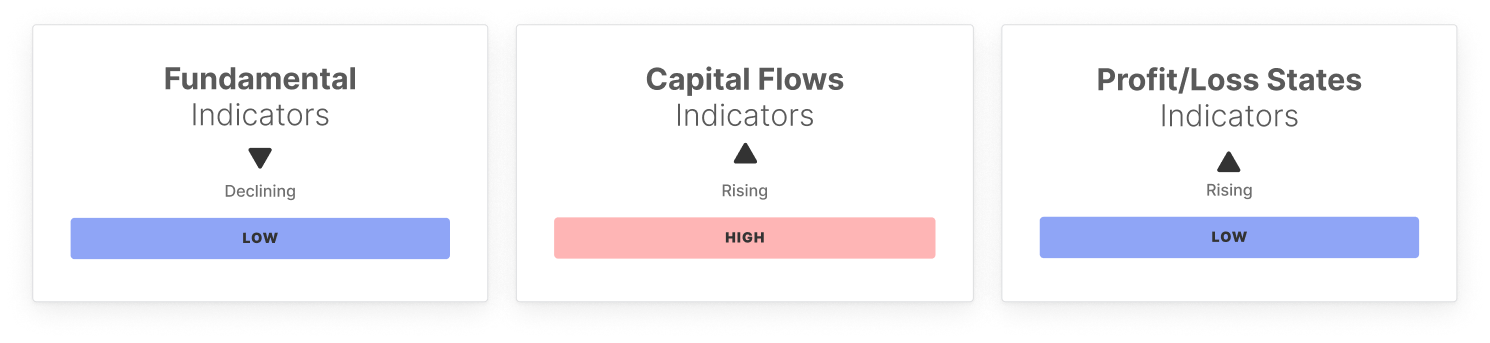
On-chain activity presents a mixed backdrop. Active addresses eased modestly, but entity-adjusted transfer volume surged above its upper band, signalling elevated capital movement. At the same time, fee pressure declined, pointing to softer block-space demand. Capital flow indicators remain fragile, with Realized Cap Change subdued, while supply dynamics show increased short-term holder influence and elevated hot capital share, increasing the market’s sensitivity to volatility.
ETF flows provided some offset, with net inflows rebounding strongly despite softer trading volumes. However, ETF MVRV eased slightly, and profit metrics remain muted, suggesting positioning remains cautious rather than euphoric.
In sum, Bitcoin’s rejection from $94K has reinforced a risk-off, consolidation-driven regime. While select indicators hint at underlying activity and institutional interest, conviction remains uneven, leaving the market vulnerable to further downside or prolonged range-bound trade until stronger demand emerges.
Off-Chain Indicators
On-Chain Indicators
🔗 Access the full report in PDF

Don't miss it!
Smart market intelligence, straight to your inbox.
Subscribe now- For on-chain metrics, dashboards, and alerts, visit Glassnode Studio
Please read our Transparency Notice when using exchange data .
Disclaimer: The content of this article solely reflects the author's opinion and does not represent the platform in any capacity. This article is not intended to serve as a reference for making investment decisions.
You may also like
Pump.fun (PUMP) Price Prediction 2026-2030: Can This Explosive Platform Dominate Solana’s DeFi Revolution?
Why is Solana no longer suitable for hosting conferences?