Exploring the Competitive Landscape: Apple Compared to Other Leading Companies in Technology Hardware, Storage, and Peripherals

Comprehensive Analysis: Apple vs. Industry Rivals
In the current dynamic and fiercely competitive business landscape, it is essential for investors and industry observers to thoroughly assess companies before making decisions. This article presents a detailed comparison of Apple Inc. (AAPL) and its leading competitors in the Technology Hardware, Storage & Peripherals sector. By examining key financial indicators, market standing, and prospects for expansion, we aim to equip investors with meaningful insights and a clearer view of Apple’s position within its industry.
Apple Inc: Company Overview
Apple stands as one of the world’s most influential corporations, offering a diverse array of hardware and software products for both individual and business customers. The iPhone remains the cornerstone of Apple’s revenue, with other offerings such as the Mac, iPad, and Apple Watch designed to complement and enhance the iPhone-centric ecosystem. The company continues to broaden its reach by introducing new services, including streaming, bundled subscriptions, and augmented reality experiences. Apple develops its own software and chipsets, while manufacturing is handled by partners like Foxconn and TSMC. Nearly half of Apple’s sales are generated through its own retail outlets, but the majority comes from collaborations and distribution agreements.
Financial Comparison: Apple and Competitors
| Company | P/E | P/B | P/S | ROE | EBITDA (in billions) | Gross Profit (in billions) | Revenue Growth |
|---|---|---|---|---|---|---|---|
| Apple Inc | 35.17 | 52.58 | 9.46 | 39.36% | $35.55 | $48.34 | 7.94% |
| Western Digital Corp | 30.90 | 12.74 | 7.88 | 20.57% | $1.48 | $1.23 | 27.4% |
| Pure Storage Inc | 181.66 | 16.25 | 6.78 | 4.03% | $0.1 | $0.7 | 16.05% |
| NetApp Inc | 18.57 | 21.42 | 3.29 | 31.11% | $0.47 | $1.23 | 2.83% |
| Super Micro Computer Inc | 24.05 | 2.79 | 0.92 | 2.62% | $0.25 | $0.47 | -15.49% |
| Logitech International SA | 22.31 | 6.92 | 3.14 | 7.99% | $0.22 | $0.51 | 6.27% |
| Diebold Nixdorf Inc | 49.45 | 2.16 | 0.68 | 3.73% | $0.11 | $0.25 | 1.95% |
| Turtle Beach Corp | 15.09 | 2.34 | 0.82 | 1.51% | $0.01 | $0.03 | -14.74% |
| Average | 48.86 | 9.23 | 3.36 | 10.22% | $0.38 | $0.63 | 3.47% |
Key Financial Insights
- Price to Earnings (P/E): Apple’s P/E ratio of 35.17 is 0.72 times lower than the sector average, indicating the stock may offer attractive growth prospects.
- Price to Book (P/B): With a P/B ratio of 52.58, which is 5.7 times higher than the industry norm, Apple’s shares could be considered expensive relative to their book value.
- Price to Sales (P/S): Apple’s P/S ratio of 9.46 is 2.82 times above the industry average, suggesting the stock may be overvalued based on sales.
- Return on Equity (ROE): Apple’s ROE stands at 39.36%, surpassing the industry average by 29.14%. This reflects the company’s strong ability to generate profits from shareholders’ equity.
- EBITDA: Apple’s EBITDA of $35.55 billion is 93.55 times greater than the industry average, highlighting its superior profitability and cash flow.
- Gross Profit: With gross profits of $48.34 billion, Apple outpaces the industry average by 76.73 times, underscoring its robust earnings from core operations.
- Revenue Growth: Apple’s revenue growth rate of 7.94% exceeds the industry average of 3.47%, demonstrating strong sales momentum and market leadership.
Debt-to-Equity Ratio Analysis
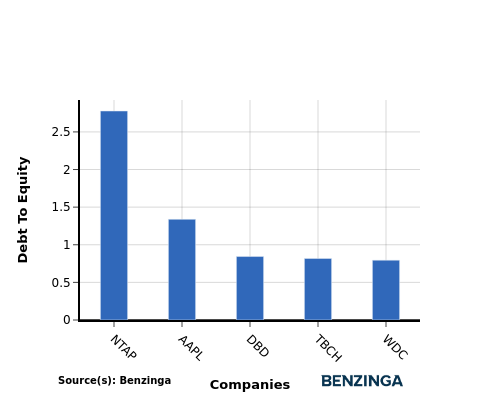
The debt-to-equity ratio measures a company’s leverage by comparing its total liabilities to its net assets. This metric is vital for assessing a company’s financial stability and risk profile.
Evaluating Apple’s debt-to-equity ratio alongside its four main competitors reveals the following:
- Apple holds a mid-range debt-to-equity ratio of 1.34 among its top peers, indicating a moderate balance between debt and equity financing.
- This balanced approach suggests Apple maintains a sound capital structure with manageable financial risk.
Summary of Findings
Within the Technology Hardware, Storage & Peripherals sector, Apple’s valuation ratios (PE, PB, PS) show a mix of relative undervaluation and overvaluation compared to its peers. However, Apple’s impressive ROE, EBITDA, gross profit, and revenue growth rates highlight its outstanding financial strength and growth trajectory in the industry.
Disclaimer: The content of this article solely reflects the author's opinion and does not represent the platform in any capacity. This article is not intended to serve as a reference for making investment decisions.
You may also like
'A widening range of opportunities': Wall Street anticipates stock market growth extending past the tech sector
Where Meta's ambitions for the metaverse fell short
ETH Stalls & Pepe Dips, Zero Knowledge Proof’s Stage 2 Coin Burns Could be the Start of a 7000x Explosion!

Targeting $900B Remittances Could Drive The Best Crypto To Buy 2026