Gold and silver prices fall, silver's technical pattern causes panic among bulls

Huitong Network, January 8th— On Wednesday (January 7), near midday in the US trading session, gold and silver prices declined, mainly due to short-term futures traders taking profits. Strong technical resistance near record highs above current price levels also caused gold and silver bulls to become cautious midweek. February gold futures were last traded at $4,467.2 per ounce, down $28.9; March silver futures were at $78.22 per ounce, down $2.819.
On Wednesday (January 7), near midday in the US trading session, gold and silver prices declined, mainly due to short-term futures traders taking profits. Strong technical resistance near record highs above current price levels also caused gold and silver bulls to become cautious midweek. February gold futures were last traded at $4,467.2 per ounce, down $28.9; March silver futures were at $78.22 per ounce, down $2.819.
The daily chart of March New York Mercantile Exchange (Comex) silver futures shows that this week's price action—especially today's sharp drop—may be forming a bearish double-top reversal pattern. Silver’s price performance for the rest of the week will be crucial in confirming this bearish double-top pattern. According to traditional technical analysis, a double-top reversal pattern is confirmed when the price breaks below the trough level between the two tops. For silver, this means March futures prices need to fall below $69.255 per ounce. There are likely many preset stop-loss sell orders below this price level. The daily price action of silver may continue to lead gold prices.
In other news, the People’s Bank of China has increased its gold reserves for 14 consecutive months, highlighting continued official demand for gold amid soaring prices to record highs. According to data released Wednesday, the People’s Bank of China increased its gold holdings by 30,000 ounces last month. Since the start of the current accumulation cycle in November 2024, China’s central bank has added about 1.35 million ounces (42 tons) of gold in total. After gold prices soared to record highs last autumn, gold prices have been volatile in recent weeks. However, thanks to central bank purchases, geopolitical concerns, and devaluation trades (investors shifting from sovereign bonds and currency markets to alternative value storage tools), gold achieved its best annual performance since 1979.
Key external market developments today: The US dollar index has strengthened slightly; crude oil prices have declined and are currently around $56.50 per barrel; the benchmark 10-year US Treasury yield is now about 4.15%.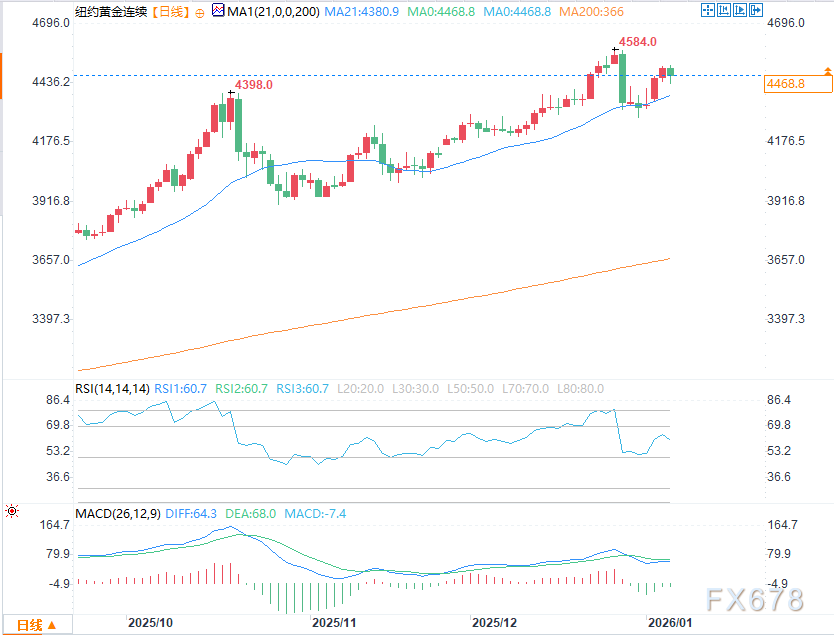
(COMEX Gold Daily Chart Source: EasyHuitong)
From a technical perspective, the next upside target for February gold futures bulls is a close above the strong resistance at the contract high/record high of $4,584.00 per ounce; the bears’ near-term downside target is to push futures prices below the strong technical support at $4,200.00 per ounce. The first resistance is at the overnight high of $4,512.40 per ounce, followed by $4,550.00 per ounce; the first support is at today’s low of $4,432.90 per ounce, followed by $4,400.00 per ounce.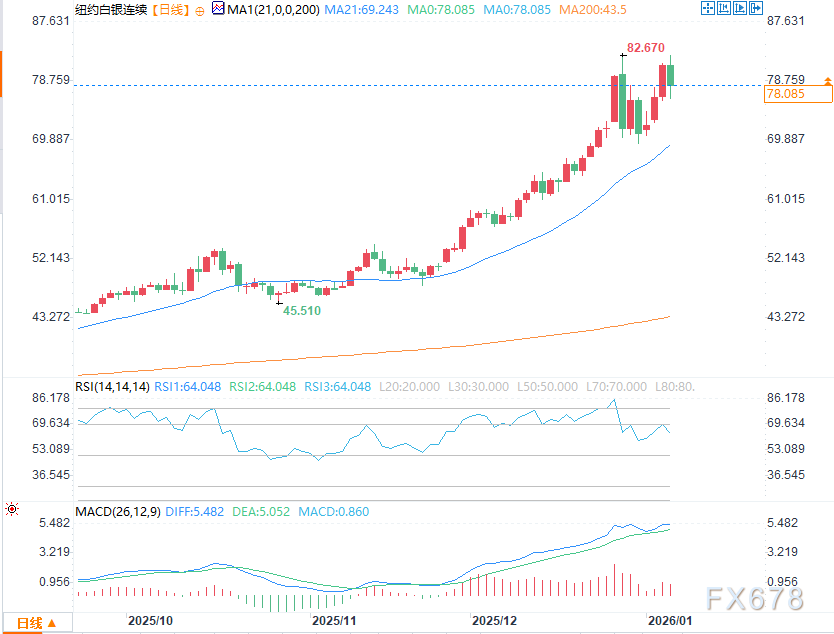
(COMEX Silver Daily Chart Source: EasyHuitong)
For March silver futures, today’s price action increases the likelihood of forming a bearish double-top reversal pattern on the daily chart. The next upside target for the bulls is a close above the strong technical resistance at the record high of $82.67 per ounce; the next downside target for the bears is a close below the strong support at last week’s low of $69.225 per ounce. The first resistance is at $79.00 per ounce, followed by $80.00 per ounce; the next support is at $75.70 per ounce, followed by $75.00 per ounce.
Note: The gold market mainly operates through two pricing mechanisms. The first is the spot market, which quotes prices for immediate purchase and delivery; the second is the futures market, which determines prices for delivery at a future date. Due to year-end position adjustments and market liquidity, the most actively traded gold futures contract on the Chicago Mercantile Exchange (CME) is currently the December contract.
Disclaimer: The content of this article solely reflects the author's opinion and does not represent the platform in any capacity. This article is not intended to serve as a reference for making investment decisions.
You may also like
Large bitcoin investors have accumulated more coins than at any time since the FTX crash in 2022
Trump throws UK automakers into turmoil once again
Cryptocurrency Market Stirs Enthusiasm as Bitcoin Holds Strong
DOJ No-Sell on Samourai Bitcoin, Advisor Says – Kriptoworld.com