

 thecryptobasic.com
Solana shows strong bullish momentum, with rising development activity and key resistance levels ahead. Will SOL test further resistance?
Solana (SOL) and other leading altcoins have started the new year on a positive note, with Solana’s price reclaiming the critical $130 level. Over the past 24 hours, Solana has fluctuated between $133.42 and $139.58, currently trading at $137.66.
In the last week, Solana has posted an impressive 11.1% gain, and its 14-day performance shows a 10.9% increase, signaling ongoing bullish sentiment.
Despite these recent milestones, the price action suggests room for growth, especially with Solana now holding above the $130 level. Traders should watch for $139.58 as the next significant resistance, with support at $133.42.
Solana Technical Analysis
On the technical end, the Ichimoku Cloud indicator suggests that the price has broken into a crucial resistance zone. Specifically, the upper boundary of the cloud, from $144, could act as a tough resistance point if the price continues to push higher.
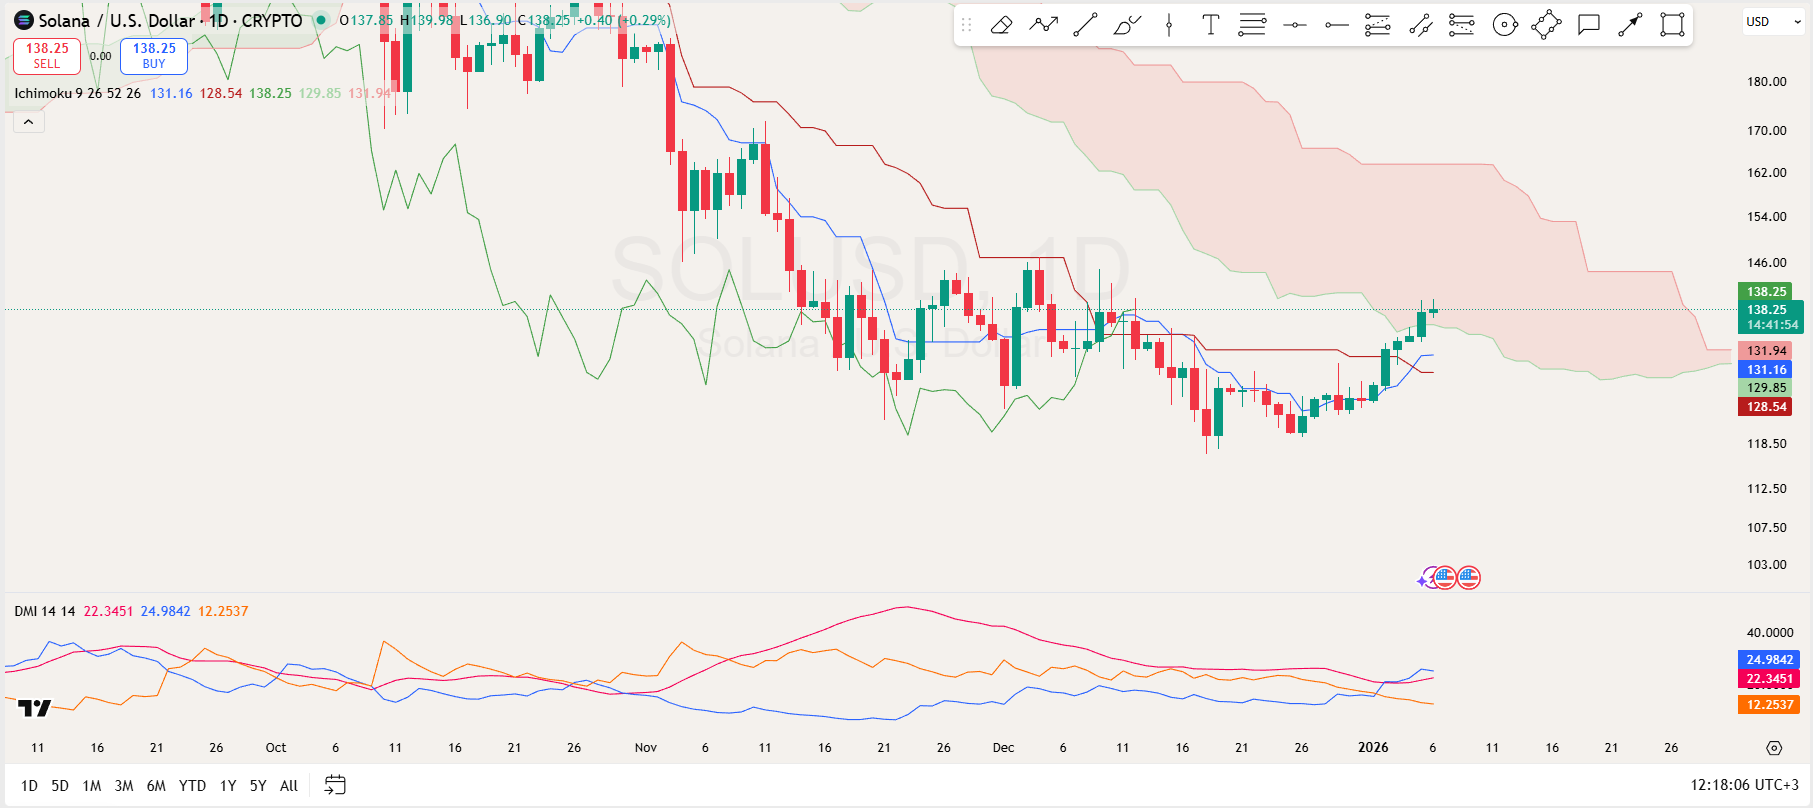
This level is critical for any continuation of the bullish momentum. If Solana successfully breaks through this resistance, the next major roadblock is likely above $163. On the downside, the lower boundary of the cloud at $129.85 acts as a strong support zone. The conversion line has also crossed above the base, another bullish signal for Solana.
Additionally, the Directional Movement Index shows that the blue +DI line is currently above the orange -DI line, signaling that the bullish trend is intact. Furthermore, the ADX at 22.35 is surging upwards, showing that the strength of the current trend is increasing.
Solana Development Activity
Looking elsewhere, Solana’s development activity is surging, as shown by data from Santiment, a market intelligence platform. The chart reveals a sharp increase in development activity after declining around January 3.
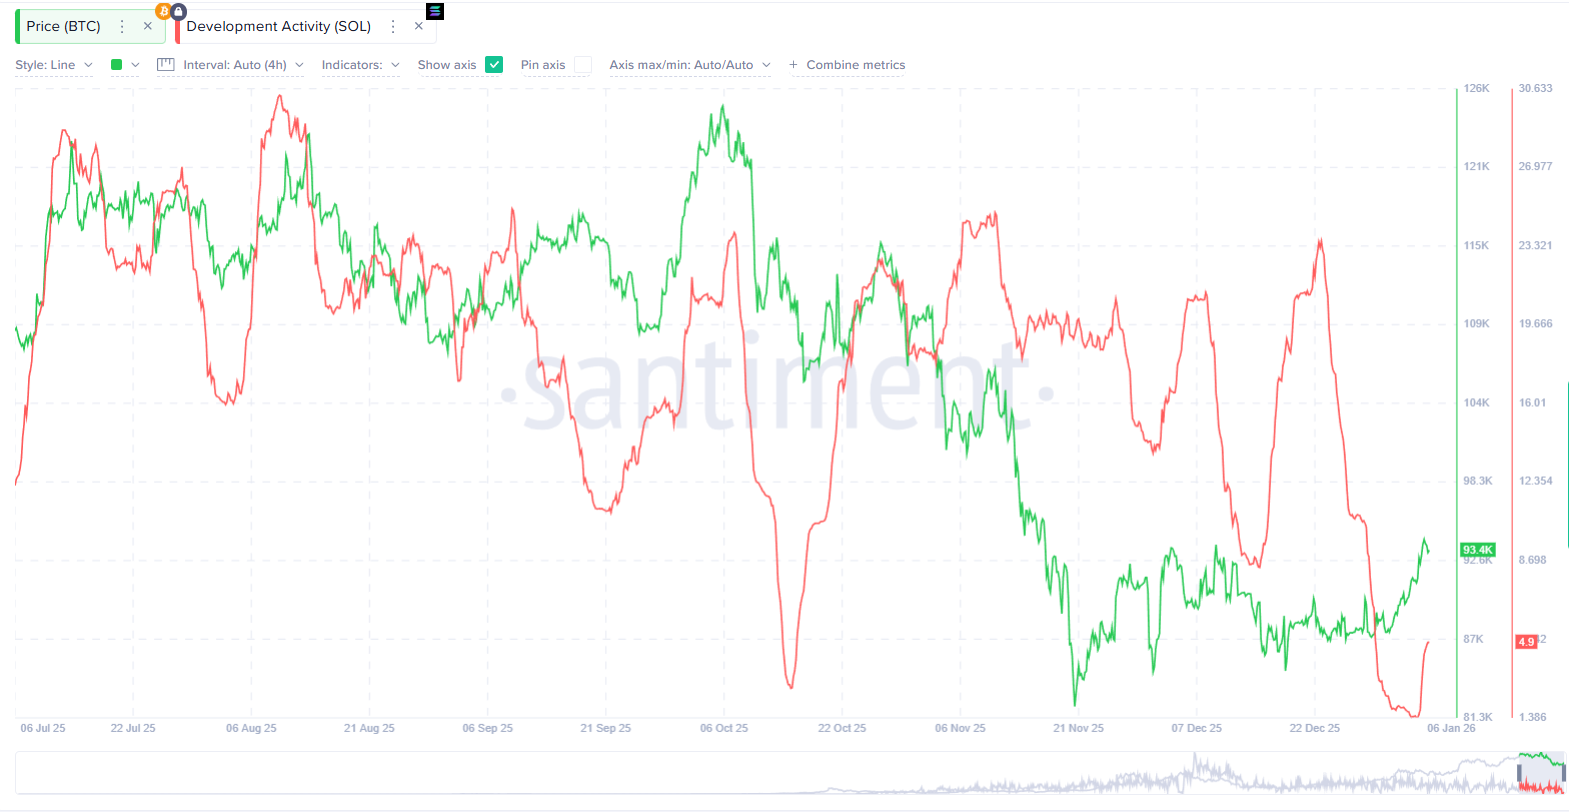
The red line represents the growth in contributions and improvements to the network. As development activity intensifies, it often correlates with long-term confidence in the project, and the rising trend in development is typically a bullish sign.