

Despite the short-term pressure on the XRP coin’s price, a long-term technical signal has brought it back into discussion. As of January 7, the price fell by 5% within 24 hours, breaking below the $2.32 support level and pulling back to $2.21 during a heavy volume sell-off. Purchases following the selling wave reduced the downward pressure, and the market’s focus shifted to whether the recovery could surpass critical resistances. Simultaneously, a rarely seen technical structure in the XRP/BTC pair increased expectations regarding XRP’s performance against Bitcoin.
XRP Price Struggles to Overcome Key Resistance Levels
By:Cointurk
Rare Technical Signal in the XRP/BTC Chart
XRP investors are focusing not only on the spot price movement but also on its relative strength against Bitcoin. According to evaluations shared among technical analysts, the XRP/BTC pair is close to breaking above the Ichimoku cloud on the monthly chart. This configuration, last observed in 2018, historically marks the beginning of periods where XRP can outperform Bitcoin.
This technical model is being interpreted alongside narratives of “asset rotation” that have resurfaced in the early days of the year. After rises led by Bitcoin, the shift of money towards altcoins had historically coincided with similar signals in past cycles. While a potential breakout in XRP/BTC does not guarantee immediate gains on the spot price, it sets up a framework that increases the likelihood of faster buying responses to declines.
Analysts emphasize that the recent pullback was more of a short-term liquidation based on forced sales rather than a slow, uncontrolled unraveling. Such movements can lay the foundation for a more robust reconstruction of the technical ground.
Important Levels for Spot Price
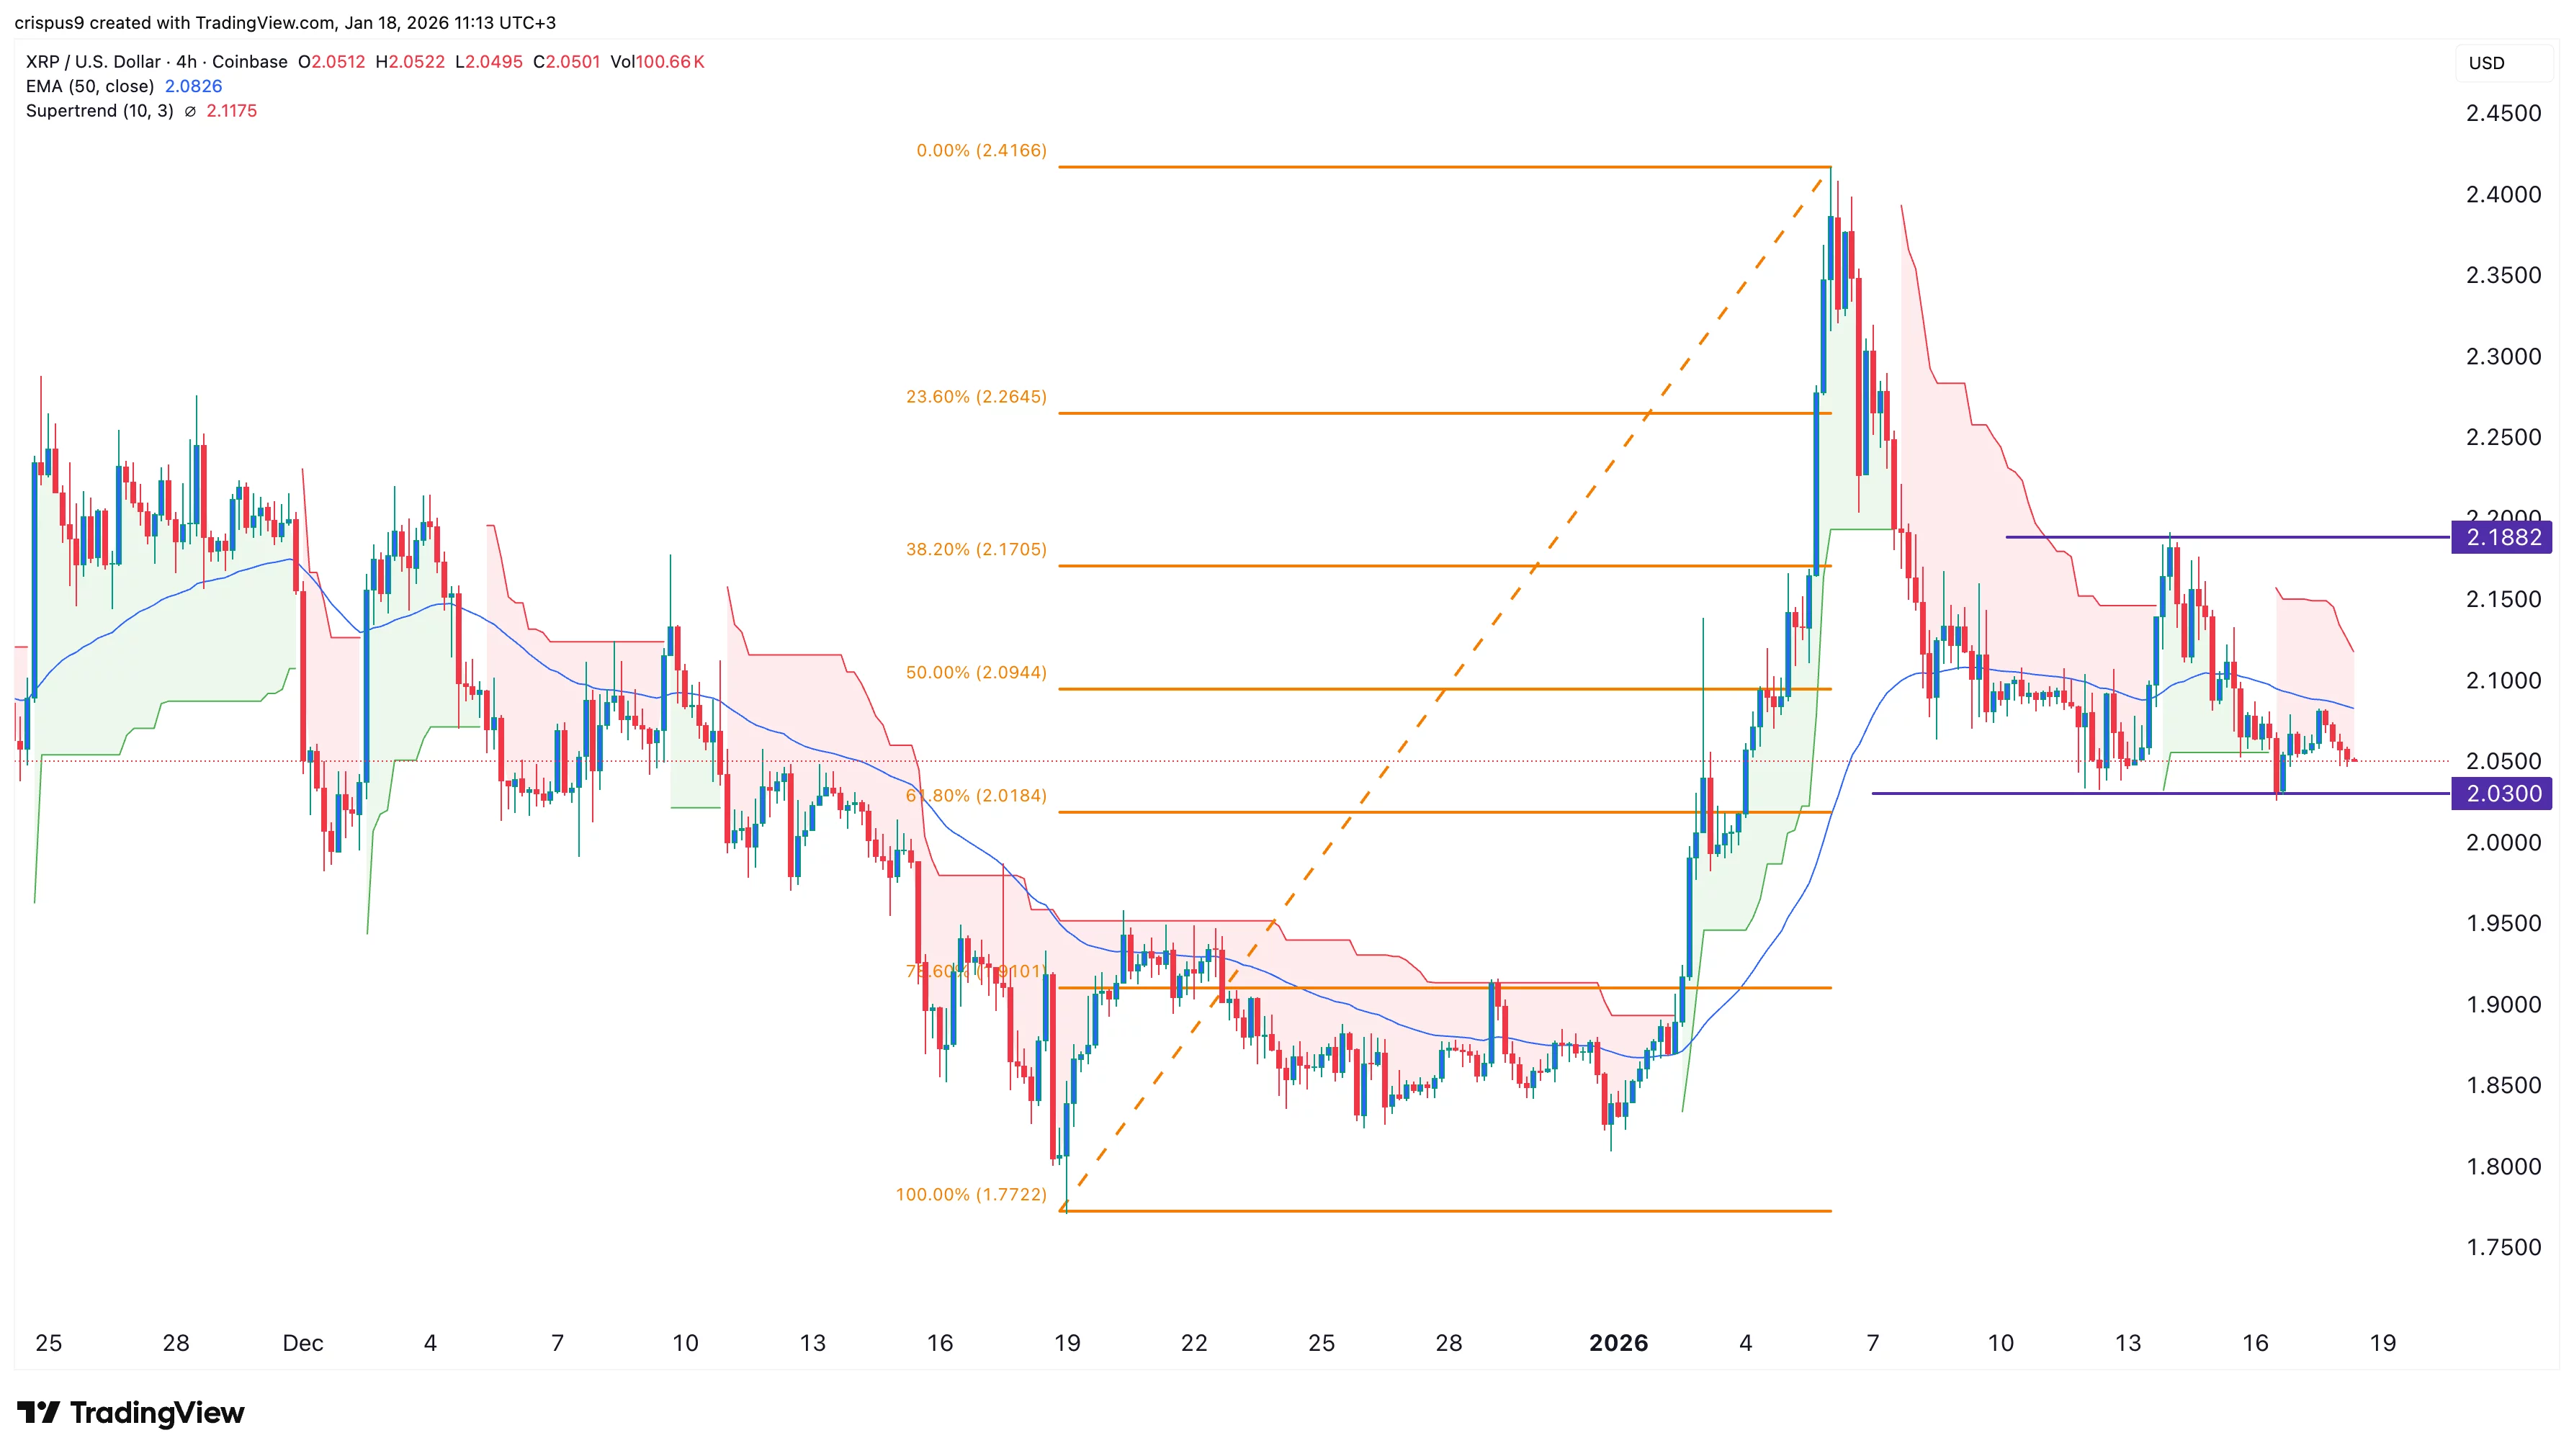
XRP dropped from $2.39 to $2.27 on January 6 and faced selling pressure around $2.31 during recovery attempts. The most notable development of the day was a sharp sell-off with a volume of 256.3 million, pushing the price down to $2.21. Though, the lack of further deepening in ongoing sales indicated buyers stepping in.
Hourly charts point to multiple defense attempts in the $2.258–$2.260 range, suggesting a search for a short-term base. The formation of higher lows and rising volume during uptrends provides a constructive appearance; however, unless the $2.31–$2.32 range is surpassed, the general trend remains in a downward channel.
For market participants, the equation is clear. As long as the $2.21 level is maintained, the pullback is interpreted as a volumetric shakeout, leaving room for a new attempt towards $2.39. Conversely, a downward breach is watched as a threshold that could trigger another wave of sales towards the next demand area.
0
0
Disclaimer: The content of this article solely reflects the author's opinion and does not represent the platform in any capacity. This article is not intended to serve as a reference for making investment decisions.
PoolX: Earn new token airdrops
Lock your assets and earn 10%+ APR
Lock now!
You may also like
China tech stocks outperform global peers on self‑sufficiency story despite slow economic growth
Cointelegraph•2026/01/18 13:15
XRP price forms a double-bottom as weekly ETF inflows jump 47%
Crypto.News•2026/01/18 13:12
China’s Latest Surge in Tech Stocks Signals a Shift Away from Economic Slowdown
101 finance•2026/01/18 13:09
What’s Driving The $1.42 Billion Comeback In Spot Bitcoin ETFs?
Newsbtc•2026/01/18 13:06
Trending news
MoreCrypto prices
MoreBitcoin
BTC
$95,011.07
-0.20%
Ethereum
ETH
$3,318.8
+0.58%
Tether USDt
USDT
$0.9995
-0.00%
BNB
BNB
$946.5
+0.45%
XRP
XRP
$2.05
-0.52%
Solana
SOL
$142.1
-1.12%
USDC
USDC
$0.9997
-0.00%
TRON
TRX
$0.3160
+1.12%
Dogecoin
DOGE
$0.1368
-0.46%
Cardano
ADA
$0.3917
-1.01%
How to buy BTC
Bitget lists BTC – Buy or sell BTC quickly on Bitget!
Trade now
Become a trader now?A welcome pack worth 6200 USDT for new users!
Sign up now