

Date: Mon, Jan 05, 2026 | 05:26 AM GMT
As 2026 kicks off, the broader cryptocurrency market is showing renewed stability. Ethereum (ETH) is up nearly 4% on the week, and momentum is gradually spreading across major altcoins — including the decentralized exchange token Aster (ASTER).
While ASTER is also posting over 4% weekly gains, the more important story is unfolding beneath the surface. Recent price action suggests a meaningful structural shift may be developing — one that could mark the early stages of a bullish continuation if key technical levels are reclaimed.
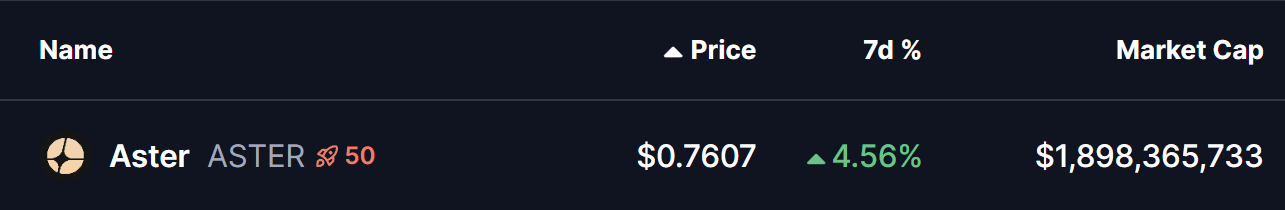 Source: Coinmarketcap
Rounding Bottom in Play
On the daily timeframe, Aster appears to be forming a rounding bottom pattern, a classic bullish reversal structure that typically develops after a prolonged corrective phase. This pattern reflects a gradual transition from aggressive selling to steady accumulation, as downside momentum fades and buyers slowly regain confidence.
The setup began after ASTER faced strong rejection near the $1.35–$1.40 neckline resistance zone, triggering a sharp decline through late November and December. That downside move eventually found strong demand near the $0.6546 support level, which has since acted as a critical base. Multiple defenses of this zone prevented further downside and helped establish a stable foundation for a potential trend reversal.
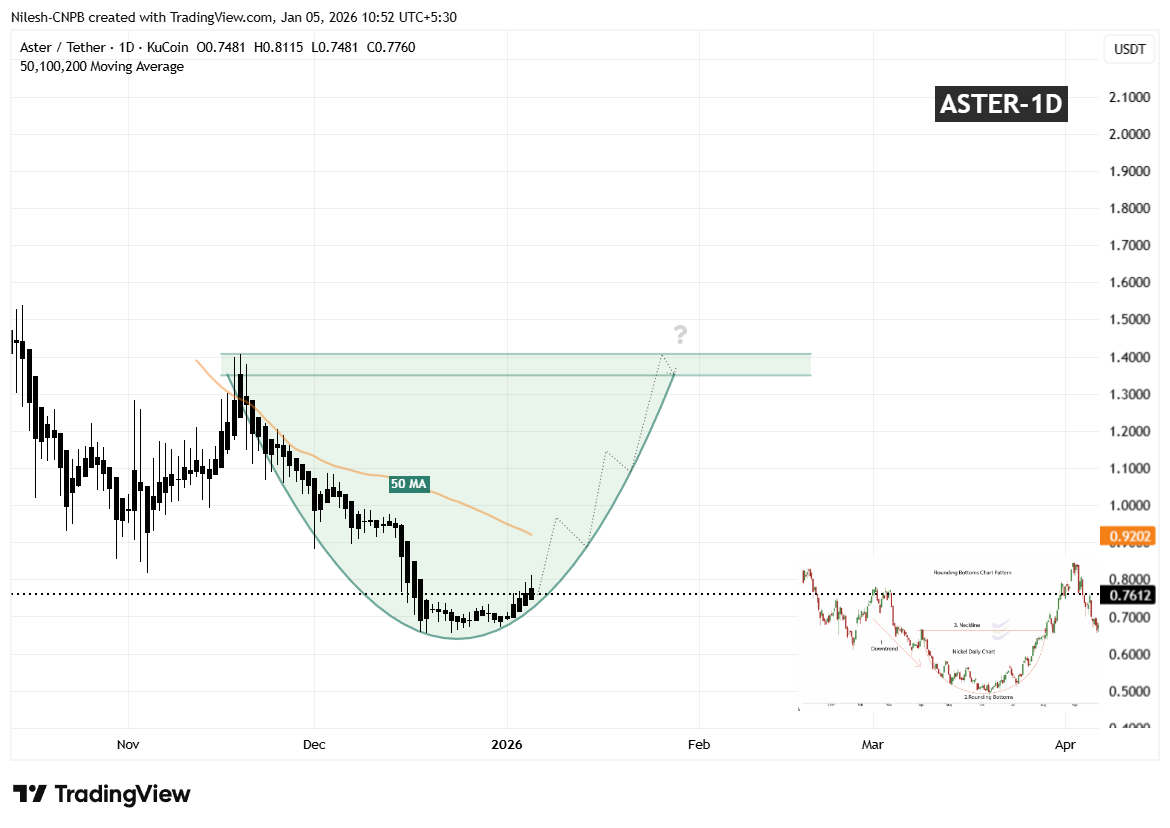 Aster (ASTER) Daily Chart/Coinsprobe (Source: Tradingview)
Since carving out that bottom, ASTER has started to curve higher in a smooth, rounded fashion — closely matching the textbook structure of a developing rounding bottom. The recent stabilization above the $0.76 region further supports the view that selling pressure is weakening and accumulation may be underway.
A key technical level now comes into focus: the 50-day moving average, currently hovering near $0.9202. This moving average has acted as dynamic resistance throughout the recovery phase, repeatedly capping upside attempts.
What’s Next for ASTER?
For the rounding bottom structure to gain confirmation, ASTER needs to reclaim the $0.9202 region and establish acceptance above the 50-day moving average. A sustained move above this zone would signal that buyers are regaining control after months of corrective price action.
Beyond that, the most significant technical barrier remains the $1.35–$1.40 neckline resistance. A clean and decisive breakout above this area would validate the entire reversal pattern and could open the door for a broader bullish expansion phase, with momentum traders and sidelined participants likely re-entering the market.
Until those levels are reclaimed, the pattern remains in development. Short-term consolidation or minor pullbacks remain possible if ASTER struggles near the 50-day MA. However, as long as price continues to form higher lows and holds above the established rounding base, the broader bottoming structure remains intact and constructive.
About Author: Nilesh Hembade is the Founder and Lead Author of Coinsprobe, with over 5 years of experience in the cryptocurrency and blockchain industry. Since launching Coinsprobe in 2023, he has been providing daily, research-driven insights through in-depth market analysis, on-chain data, and technical research.