thecryptobasic.com
XRP faces key resistance at the 0.5 Fibonacci level, with the next major move dependent on whether support holds.
XRP is currently sitting at $2.06, with a modest 24-hour surge of 0.1%. Over the last 24 hours, the price has fluctuated between $2.03 and $2.10. Despite the fluctuations, XRP has demonstrated resilience, holding above the $2.05 mark, which suggests steady demand at these levels.
Notably, over the past 7 days, XRP has seen a negative performance, down by 13.4%, indicating strong short-term bearish momentum. Within these 14 days, XRP has gained 10.7%, reflecting a continued medium term upward trend. More impressively, over the 30 days, XRP has increased by 1.9%. As these fluctuations continue, the question remains: can XRP maintain support and surge higher?
Can XRP Maintain Support?
A TradingView chart shows XRP trading within a clearly defined Fibonacci retracement range, with recent price action pulling back from the upper boundary near $2.41. During the latest move, XRP declined from this upper range, but buyers stepped in before the price could test the 0.618 Fibonacci level at around $2.02.
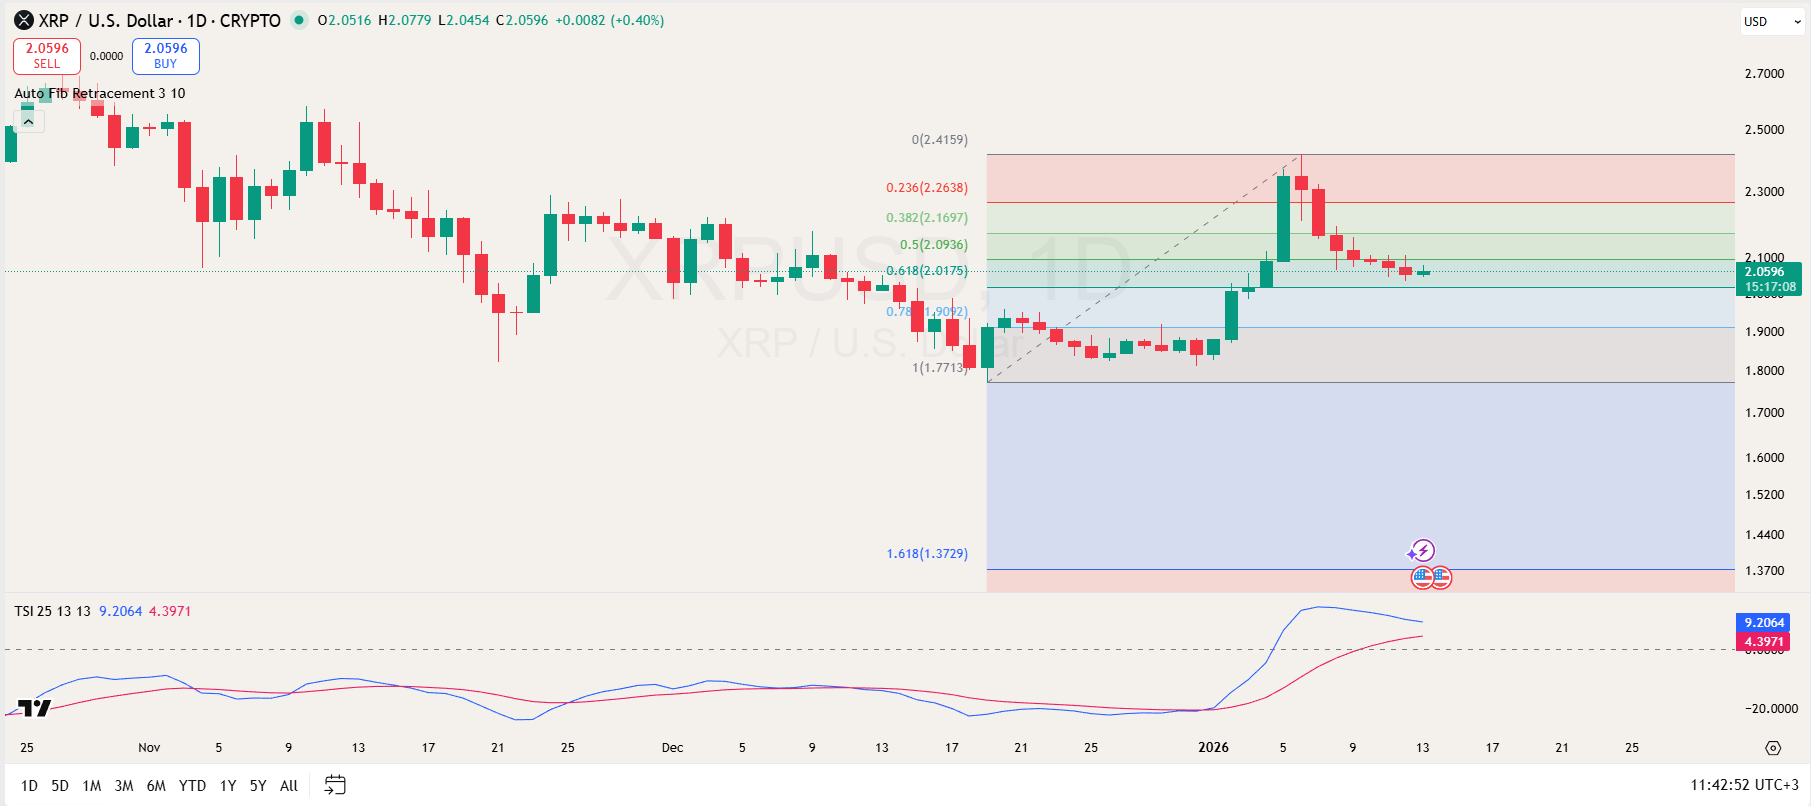
For now, the next price action would depend on whether XRP holds this support and reverses upward. Further, overhead resistance now starts at the 0.5 Fibonacci level near $2.09.
If XRP fails to reclaim the $2.09–$2.17 zone, downside pressure could return, with first support at the 0.618 level, followed by deeper support at the 0.786 retracement near $1.91. A loss of that level would expose the lower demand area around $1.77, which marks the base of the broader Fibonacci structure.
Meanwhile, the True Strength Index remains elevated but has begun to slope downward, signaling cooling momentum rather than outright weakness. This suggests XRP is consolidating after a strong impulse move, with the next directional break likely to occur once momentum decisively resets or reaccelerates.
XRP Case Scenarios
Elsewhere, in the analysis shared by More Crypto Online, the Elliott Wave theory is applied to explain XRP’s price action, with the market currently looking lifeless.
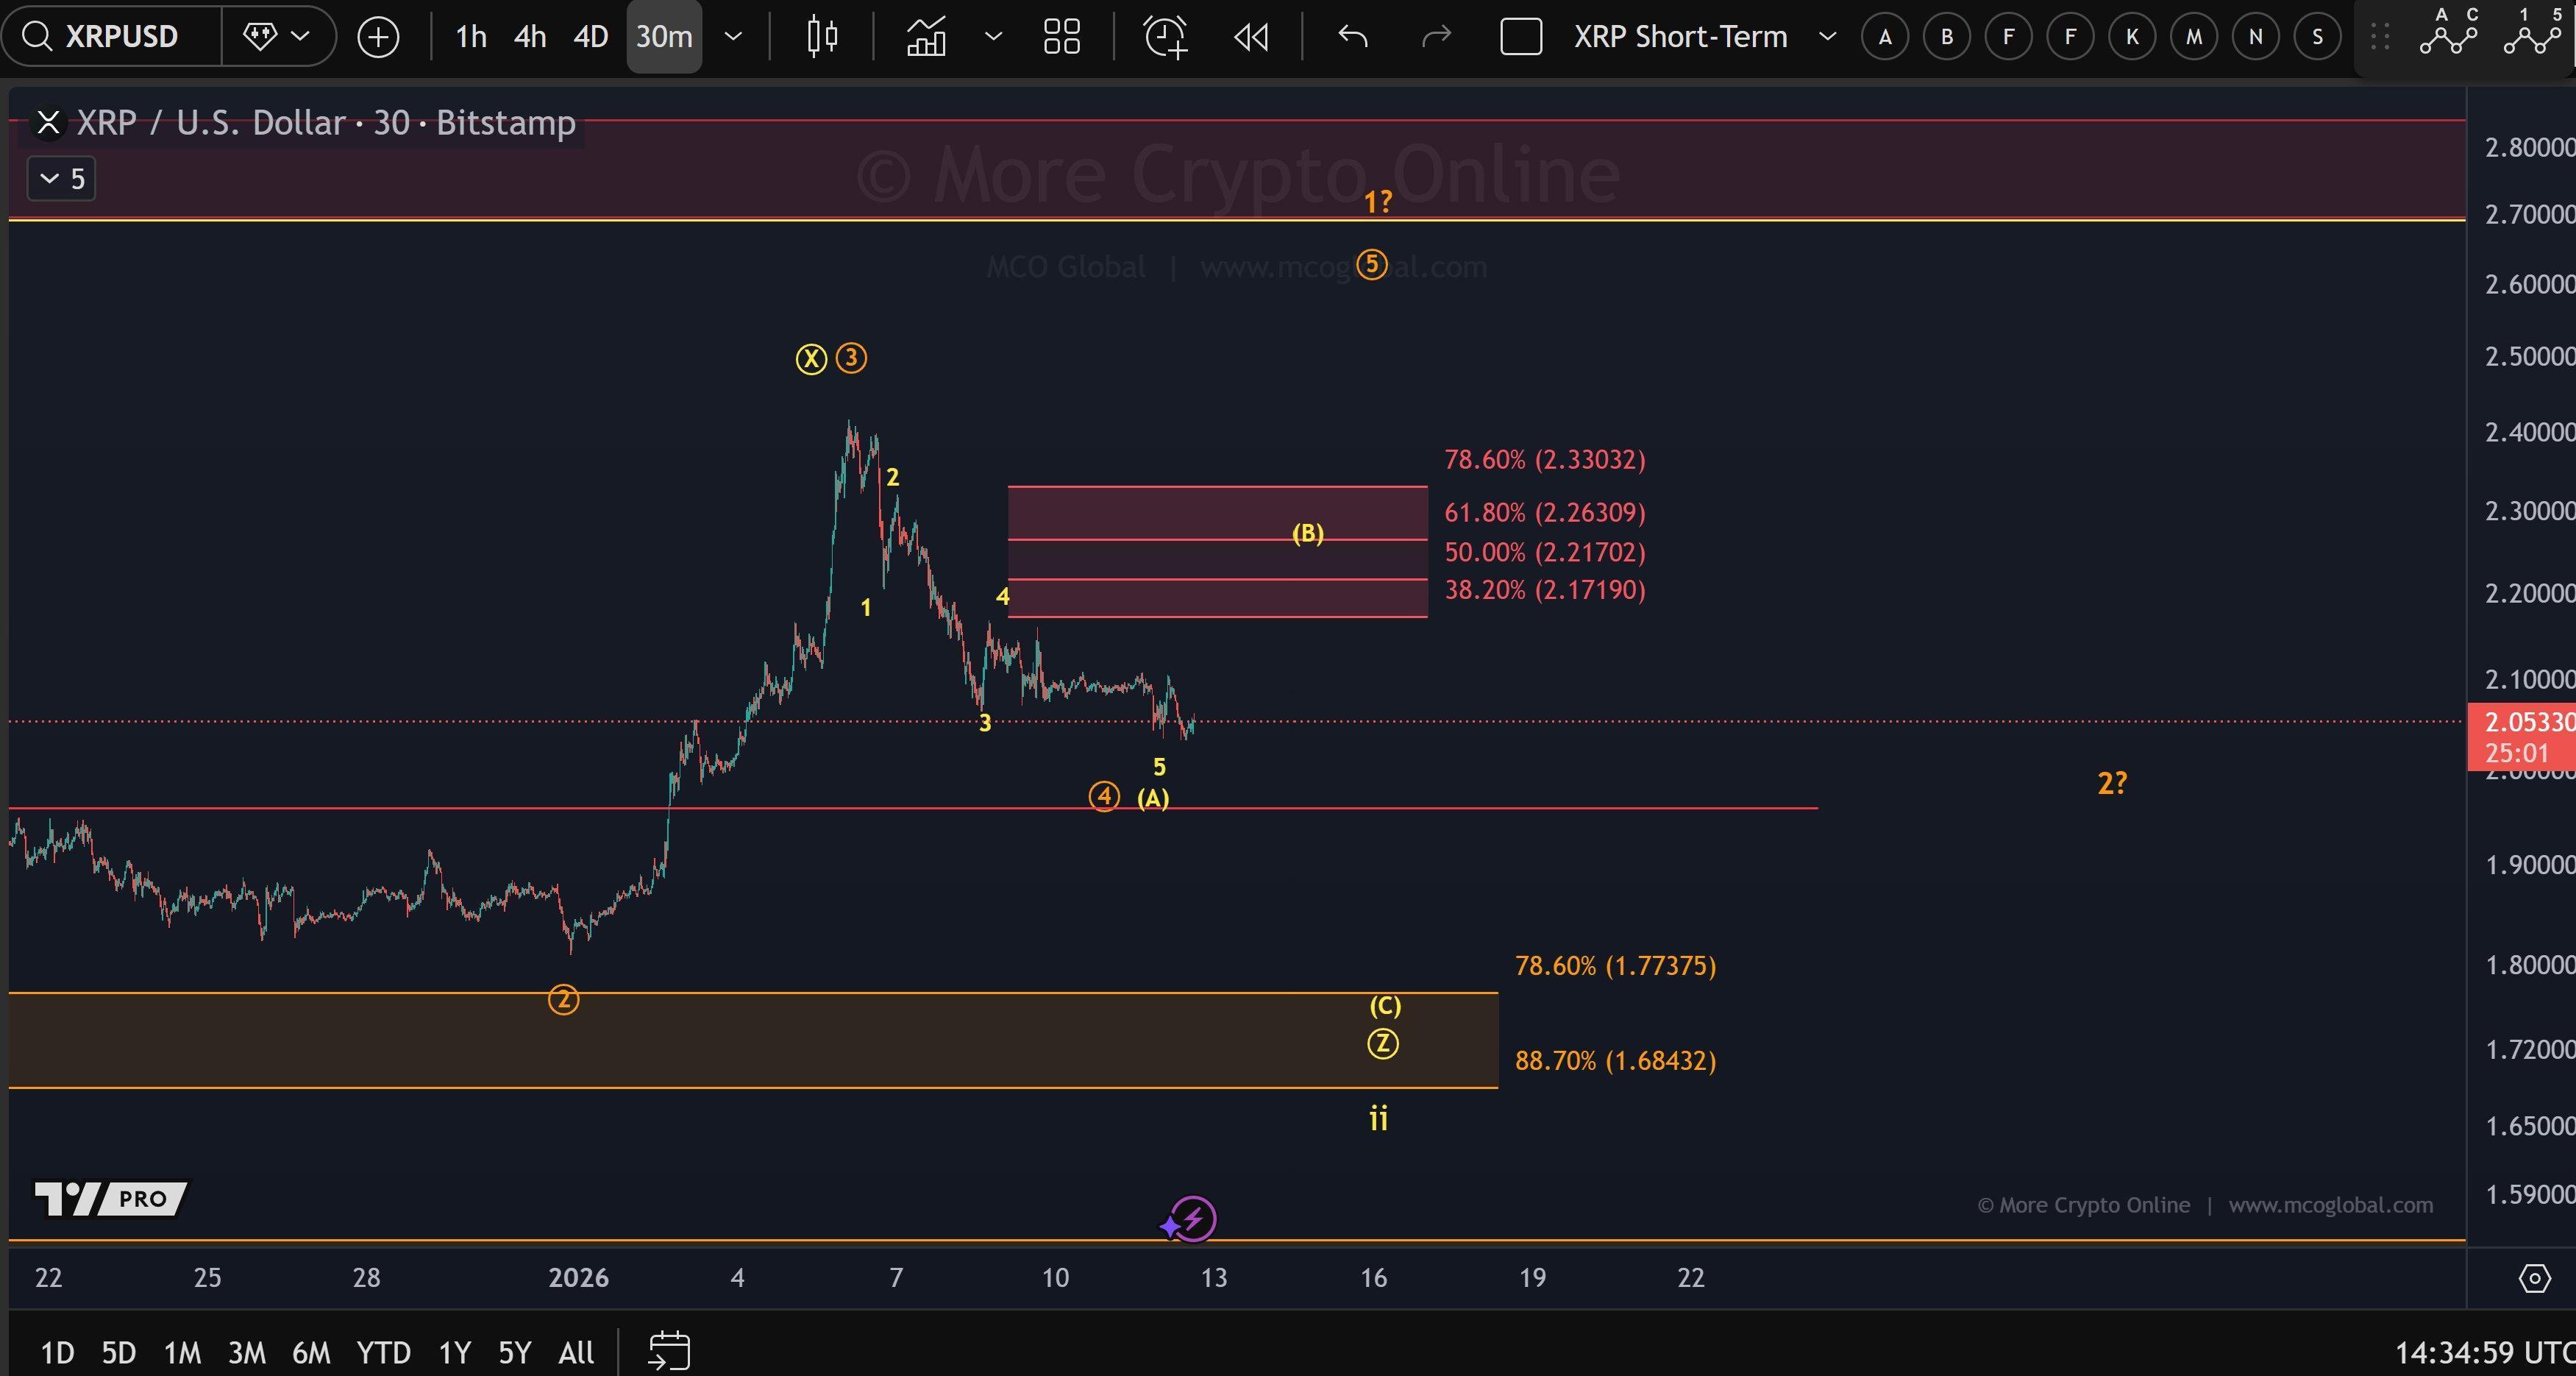
The key focus now is on the start of wave B, which will be pivotal in determining whether the market follows the yellow scenario (an upward move) or the orange scenario (a continued downtrend). Resistance is firmly set between $2.17 and $2.33, acting as an obstacle for any immediate bullish momentum.
Currently, the attention is on the $1.96 support level, which serves as the next critical structural point. A break below this level could indicate further downside, potentially testing support zones around $1.77 and $1.68.