
Shiba Inu has formed another death cross on its hourly chart as selling pressure mounts across the meme coin sector. The 50-period moving average has crossed below the 200-period moving average, signaling potential weakness in the short-term trend.
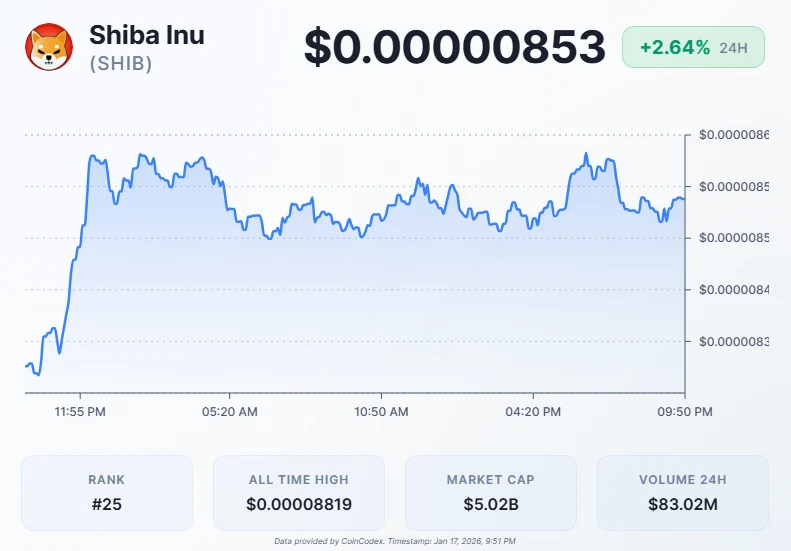
The development marks a sharp reversal from the optimistic sentiment that characterized early January. SHIB currently trades at $0.00000853, up 2.64% over the past 24 hours despite a bearish technical signal.
Early 2026 Rally Proves Unsustainable
Shiba Inu began the year with significant momentum. The token surged to $0.00001017 within the first few days of January, riding a wave of enthusiasm sweeping the meme coin market.
The rally proved short-lived. Between January 6 and January 12, SHIB declined in six consecutive sessions out of seven trading days. Profit-taking activity accelerated as early buyers locked in gains from the initial price spike.
A brief recovery attempt saw the token climb to $0.00000912. Bears quickly regained control, pushing prices lower once again. The subsequent sell-off drove SHIB down to $0.00000815, marking a two-day losing streak.
Meme coins have struggled to maintain upward momentum. Traders appear increasingly willing to sell into strength rather than accumulate positions. The absence of new catalysts has left the sector vulnerable to quick reversals.
Technical Patterns Show Mixed Signals
The current hourly death cross is not the first such occurrence in recent weeks. SHIB experienced a similar pattern on December 31, 2025, as the previous year drew to a close.
That bearish signal was quickly negated. A golden cross appeared on the hourly chart as 2026 began, coinciding with the strong price rally that followed. The rapid shift between bearish and bullish crossovers highlights the volatility inherent in short-term technical indicators.
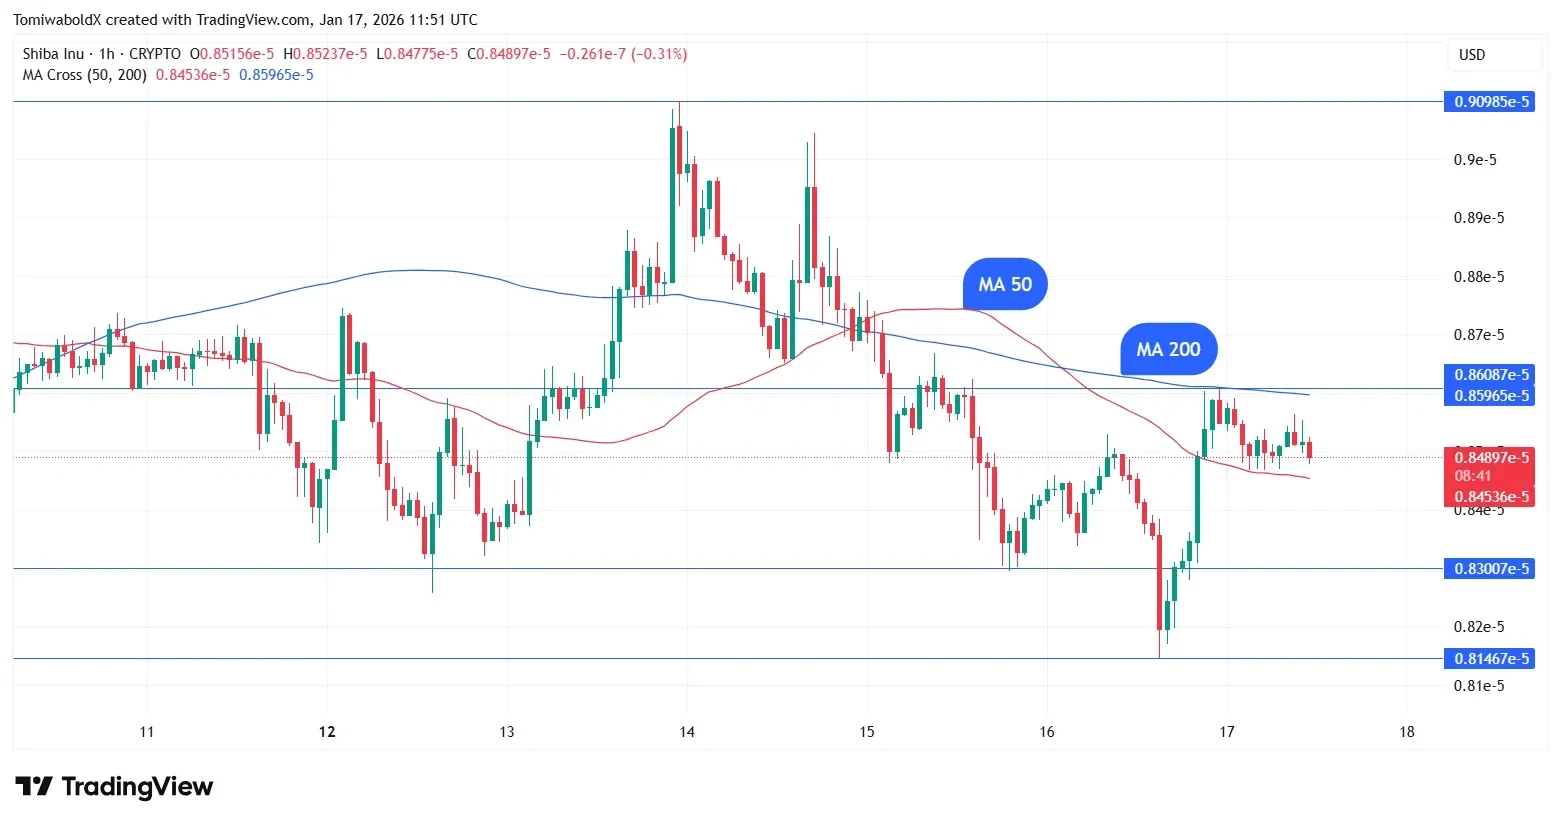
Source: TradingView
Hourly moving average crossovers can signal important shifts in fast-moving markets. Their predictive value remains limited in many cases. The Shiba Inu price action demonstrates how quickly these patterns can reverse, particularly in high-volume, speculative assets.