
Key Takeaways
- Ethereum (ETH) is consolidating near the $3,300–$3,315 range after gaining nearly 7% this week.
- The daily chart shows a well-defined ascending triangle, a bullish continuation pattern.
- A confirmed breakout above $3,402 could open the door for a move toward the $4,184 target
As of January 18, 2026, Ethereum (ETH) is trading steadily in the $3,300–$3,315 range, showing impressive resilience as the broader crypto market continues to build momentum into the new year. ETH has already climbed nearly 7% this week, signaling renewed buyer interest after months of consolidation.
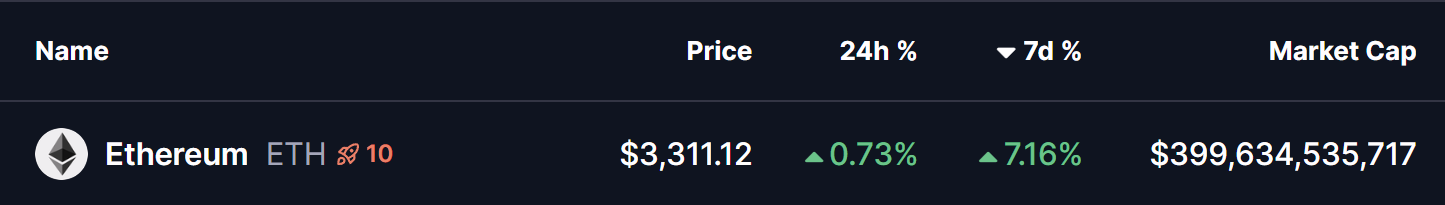 Source: Coinmarketcap
More importantly, Ethereum’s chart structure is flashing a technically compelling setup that has traders watching closely. With pressure building just below a major resistance zone, the big question now is whether bulls can finally push ETH above the psychologically important $4,000 level in the coming week.
Ascending Triangle In Play
On the daily chart, Ethereum is forming a classic ascending triangle pattern that has been developing since late 2025. This bullish continuation structure is defined by a series of higher lows pressing upward against a well-established horizontal resistance zone near $3,400.
Price action shows ETH consistently respecting the rising support trendline, with buyers stepping in on every dip. Most recently, ETH bounced cleanly from this ascending support and has once again pushed back toward the upper boundary of the triangle around the $3,402 region.
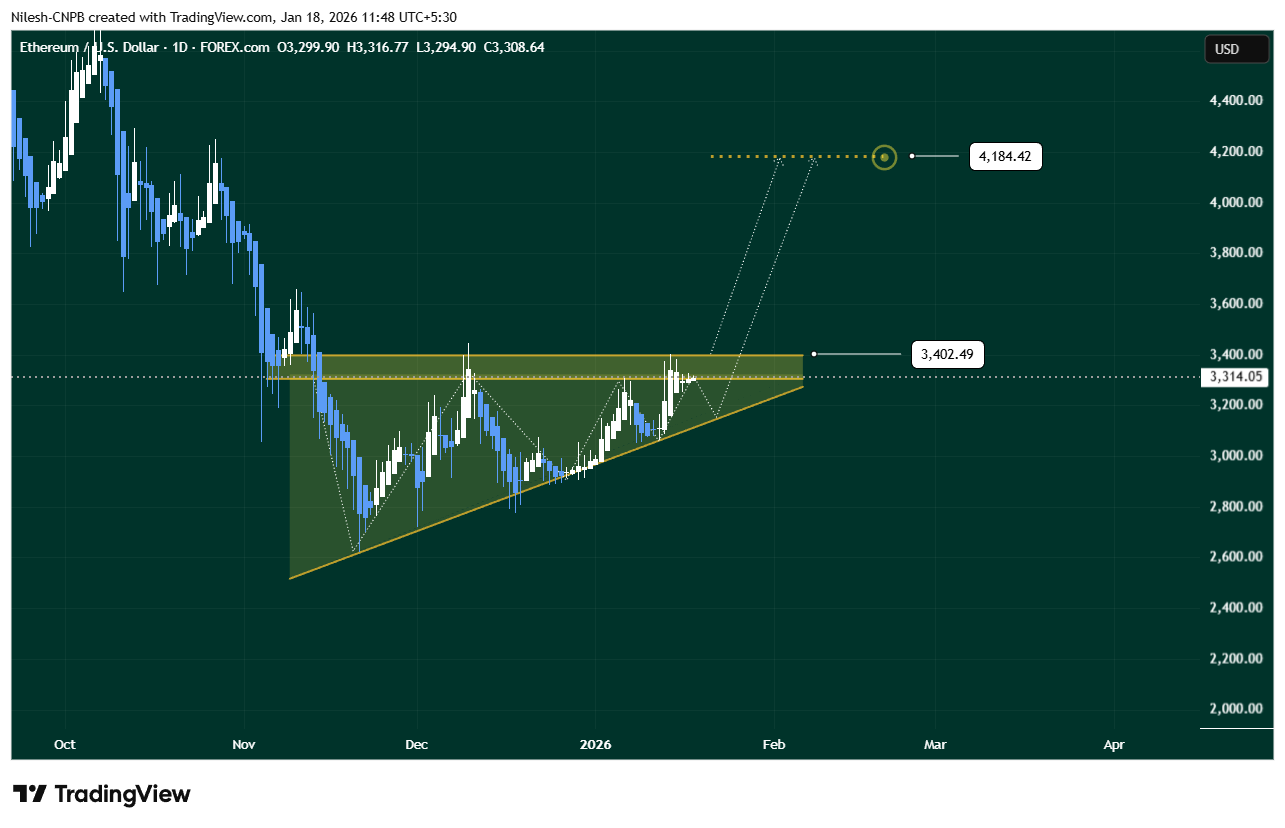 Ethereum (ETH) Daily Chart/Coinsprobe (Source: Tradingview)
This repeated defense of higher lows suggests growing confidence among market participants. Rather than selling into strength, buyers appear willing to accumulate on pullbacks, gradually tightening the range and increasing the odds of a decisive breakout.
Ethereum (ETH) Price Prediction Next Week
From here, Ethereum looks set for another test of the $3,402 resistance zone. A clean daily close above this level would be a major technical signal, potentially confirming the ascending triangle breakout.
On the flip side, if ETH faces rejection at resistance, a short-term dip toward the rising support trendline near $3,158 remains possible. Such a pullback would still keep the bullish structure intact, provided the higher-low formation continues to hold.
In both scenarios, the key level remains the $3,402 neckline. A decisive breakout above this zone, followed by sustained acceptance and a successful retest as support, would validate the pattern and likely trigger a stronger bullish expansion. Based on the triangle’s measured move, the upside target sits near $4,184 — representing roughly a 23% gain from current price levels.
Fundamentals Reinforce the Bullish Case
The technical picture is further supported by improving on-chain fundamentals. Ethereum recently recorded its highest-ever daily transaction count, surpassing 2.59 million transactions on January 15. This surge in network activity reflects growing usage and demand, reinforcing the bullish narrative behind the current price structure.
Bottom Line
Ethereum is approaching a pivotal moment. The ascending triangle pattern is tightening, momentum is building, and on-chain data continues to lean positive. While short-term volatility remains a given in crypto markets, the technical and fundamental setup suggests bulls are positioning for a meaningful move.
If ETH can break and hold above the $3,402 resistance, a push toward $4,000 and beyond could come faster than many expect. All eyes are now on the charts — next week may prove decisive for Ethereum’s next major leg higher.
FAQ
Is Ethereum forming a bullish pattern?
Yes. Ethereum is forming an ascending triangle on the daily timeframe, which is typically considered a bullish continuation pattern.
What is the key resistance level for ETH right now?
The major resistance zone lies around $3,402. A daily close above this level would confirm a bullish breakout.
What is the upside target if ETH breaks out?
Based on the measured move of the ascending triangle, the upside target is near $4,184.
What happens if Ethereum fails to break resistance?
If ETH is rejected at resistance, it could retest its rising support trendline near $3,158 while maintaining the broader bullish structure.
Are fundamentals supporting Ethereum’s price action?
Yes. Ethereum recently recorded its highest-ever daily transaction count, indicating strong network usage and positive on-chain momentum.
About Author: Nilesh Hembade is the Founder and Lead Author of Coinsprobe, with over 5 years of experience in the cryptocurrency and blockchain industry. Since launching Coinsprobe in 2023, he has been providing daily, research-driven insights through in-depth market analysis, on-chain data, and technical research.